
Improved @property section in Elements > Styles
Editable @property rule
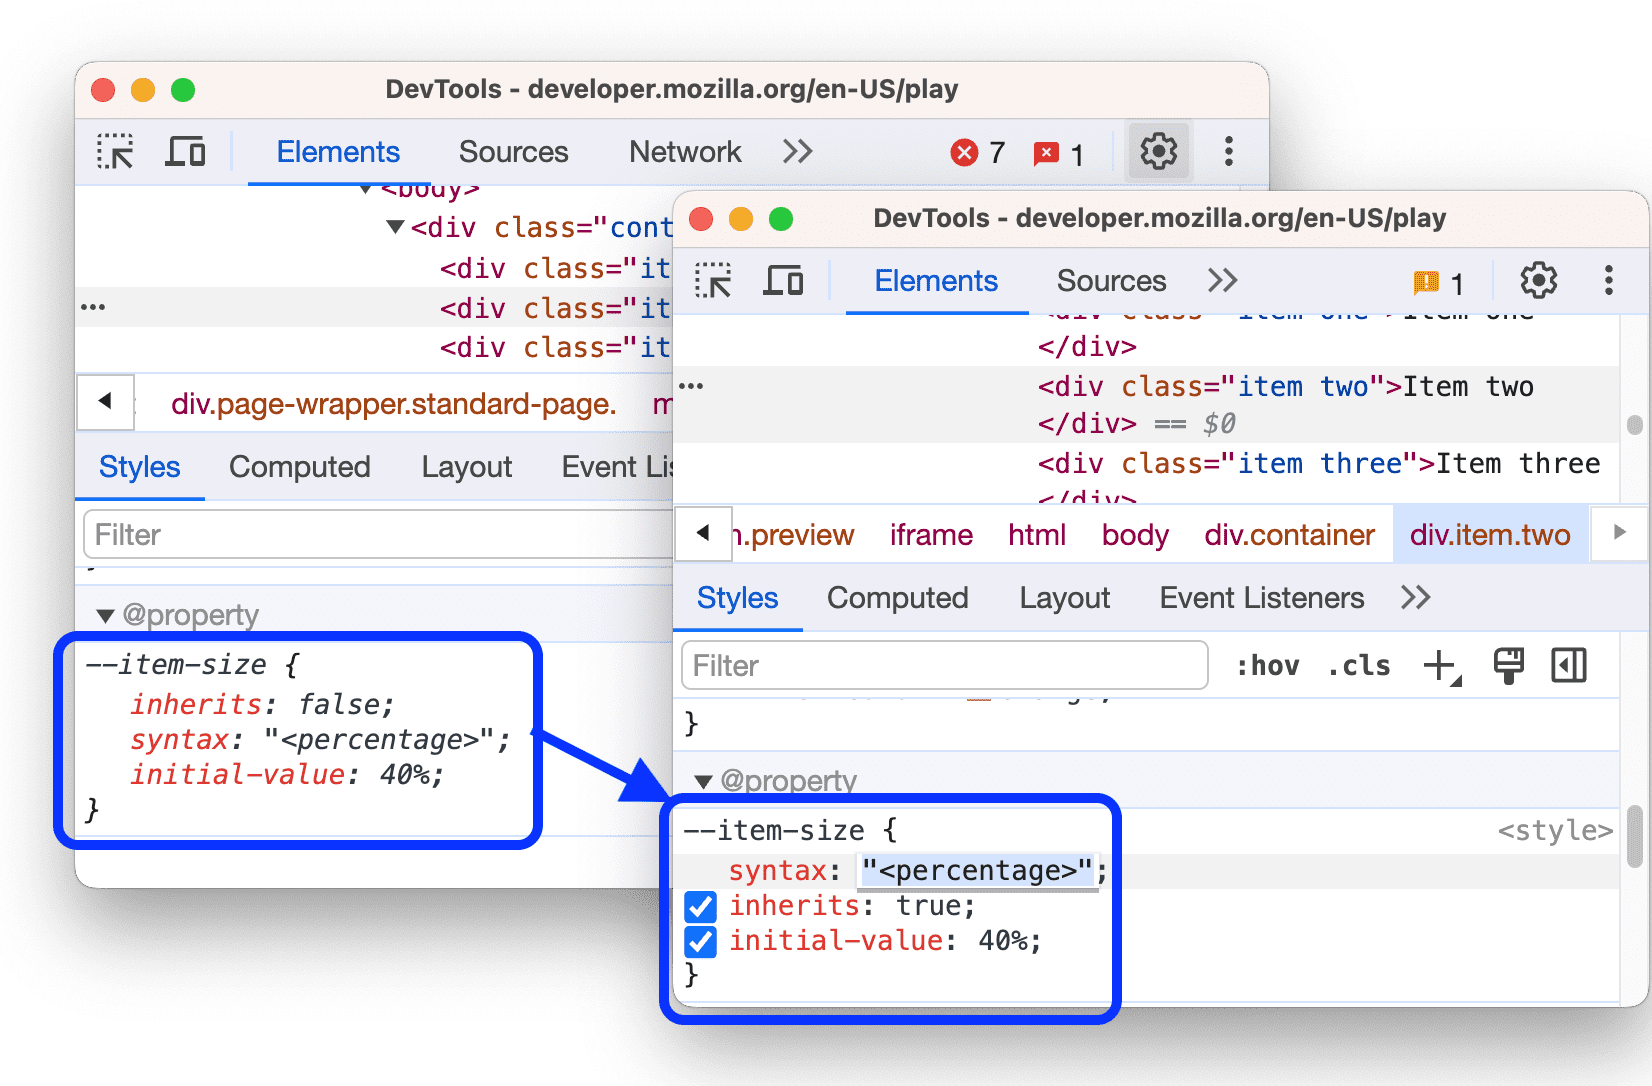
You can now edit the @property CSS at-rule in the corresponding section in the Elements > Styles pane.
Chromium issue: 1471123.
Issues with invalid @property rules are reported
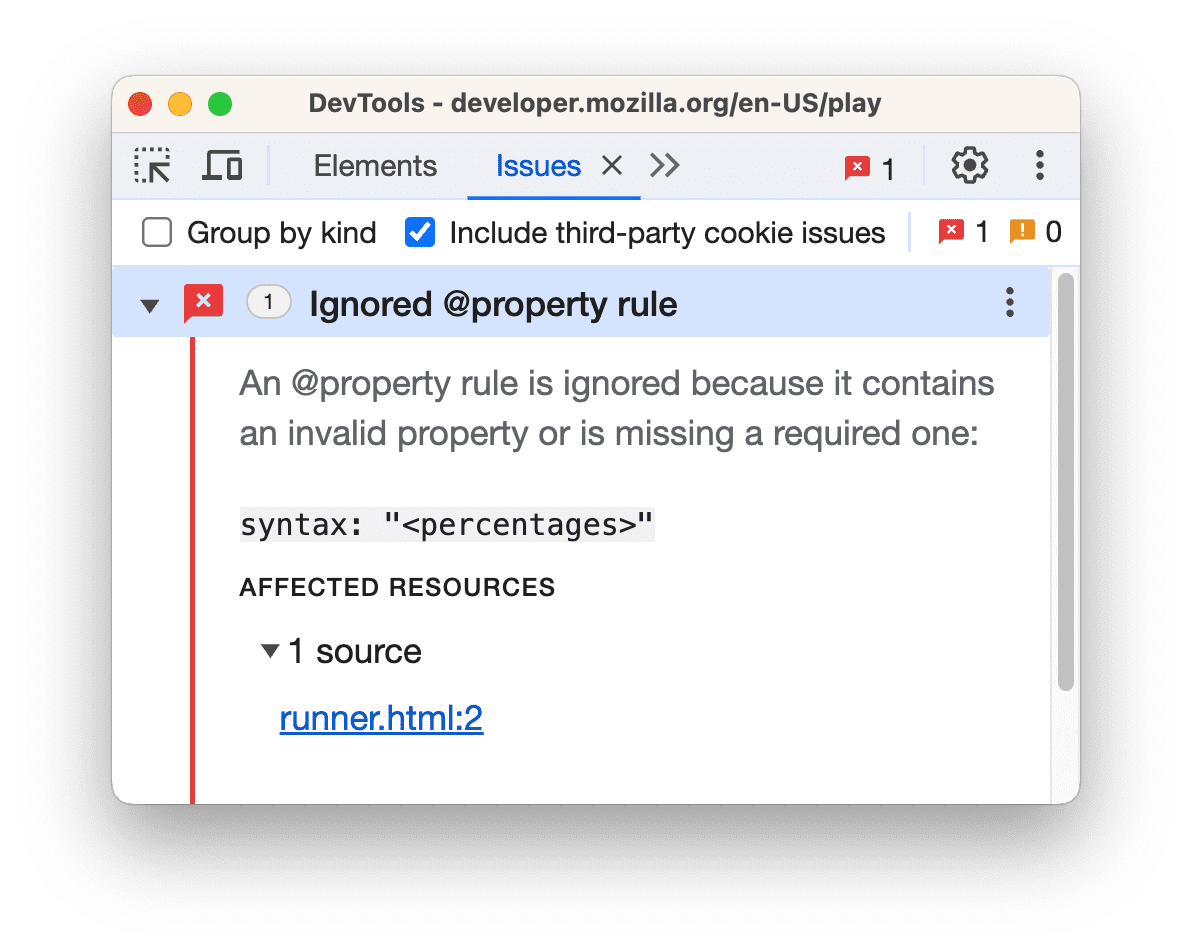
The Issues tab now reports issues with invalid declarations in @property rules.
Chromium issue: 1473283.
Updated list of devices to emulate
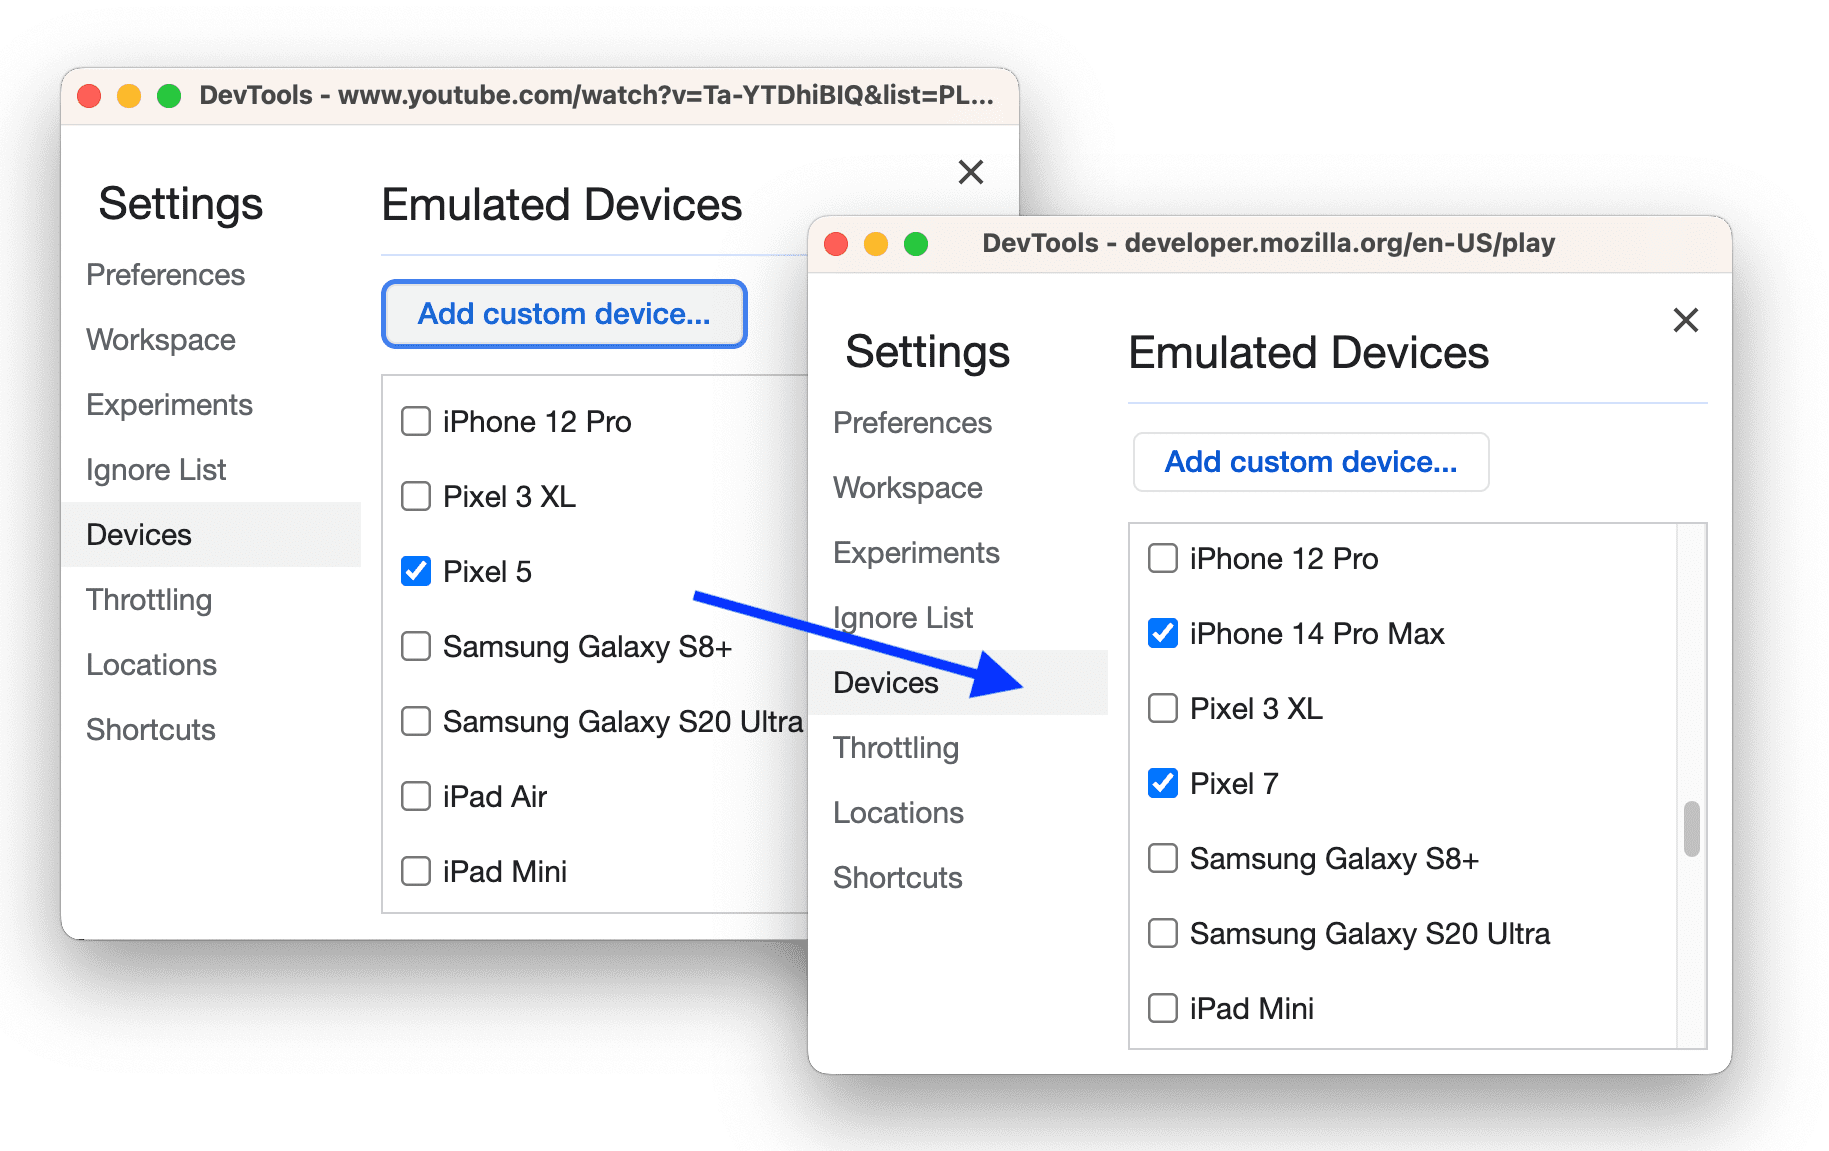
The user agent strings in Settings > Devices has been updated to reflect the average usage of browsers and operating systems. You can now emulate more of the up-to-date devices in device mode.
Chromium issue: 1479733.
Pretty-print inline JSON in script tags in Sources
The Sources panel now supports pretty-printing inline JSON in <script> HTML tags for easier debugging.

Chromium issues: 406900, 1473875.
Autocomplete private fields in Console
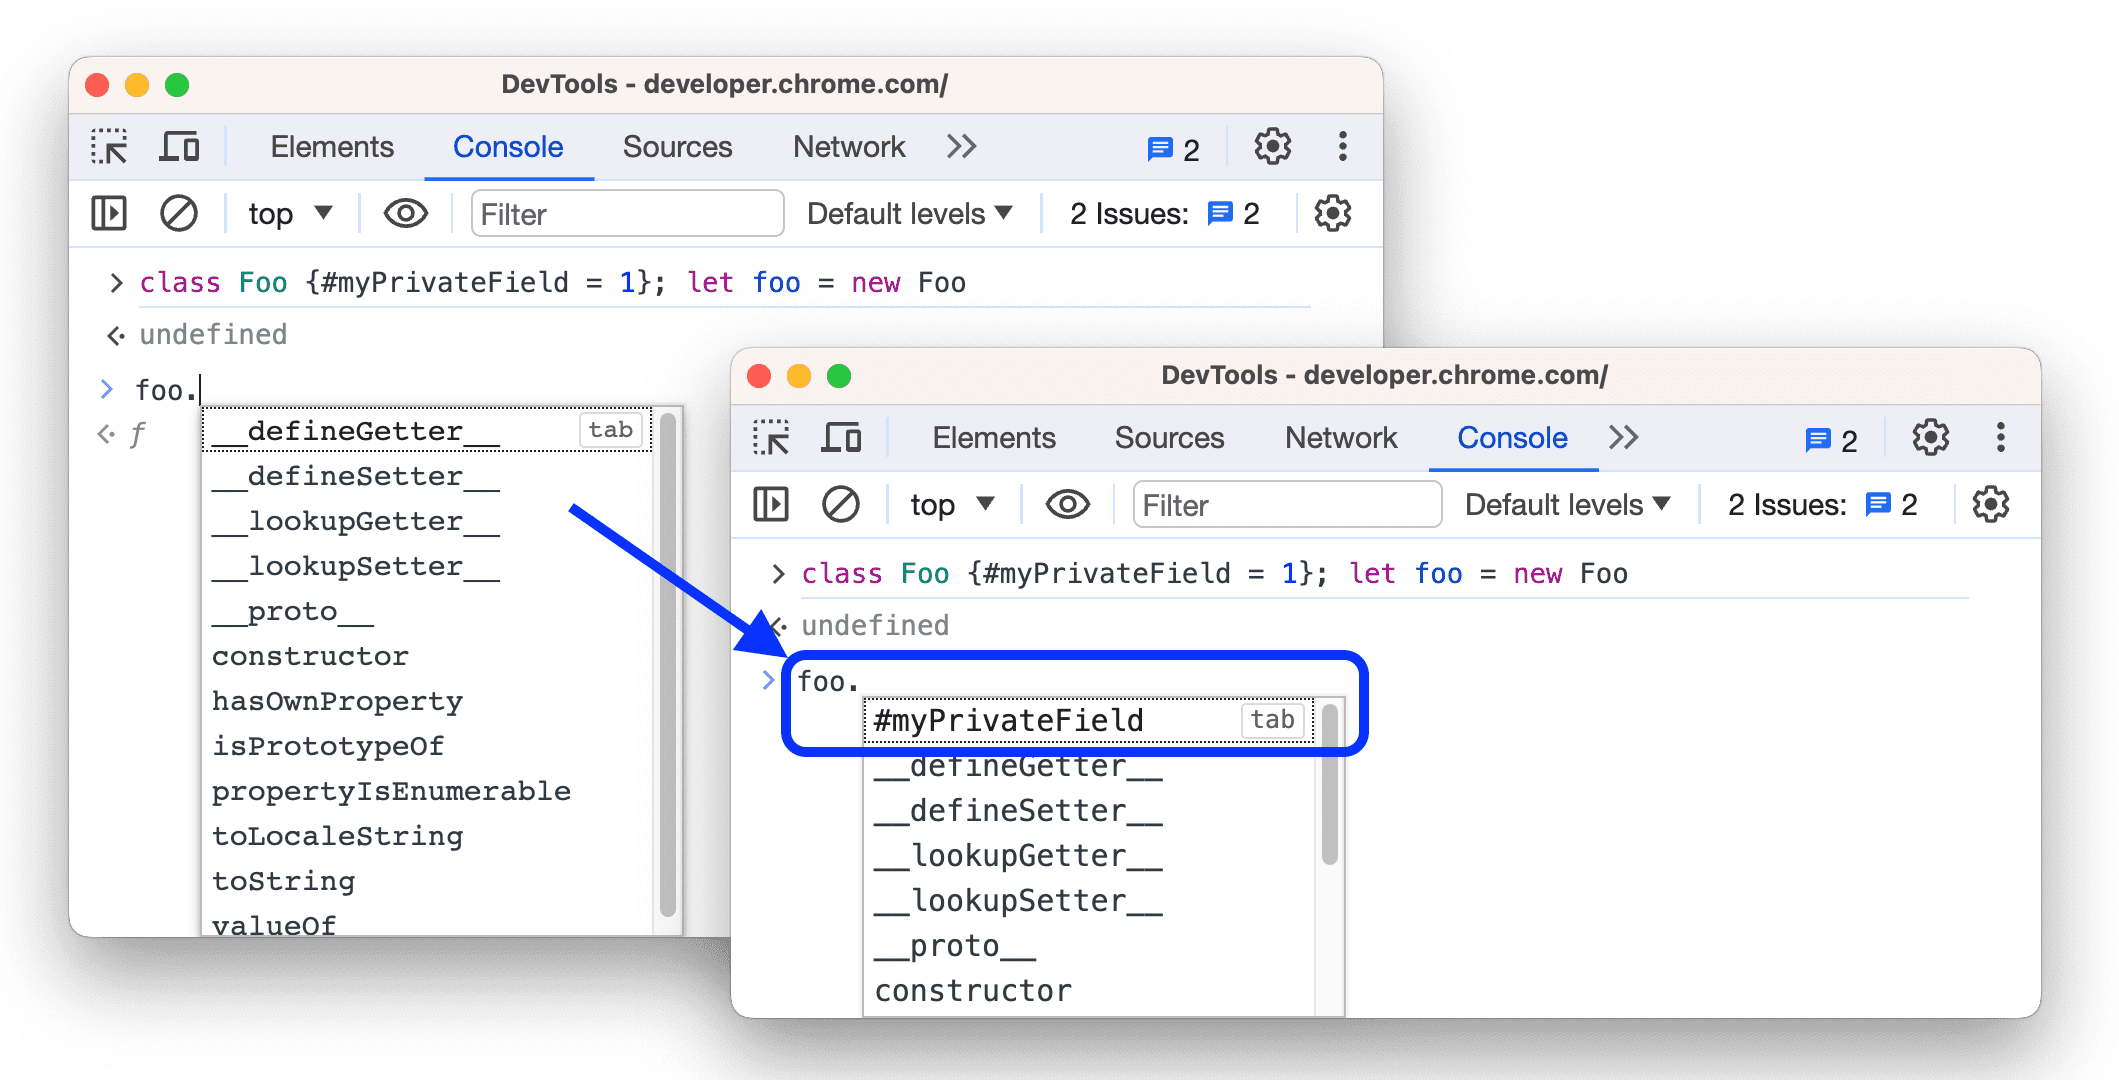
You can now autocomplete private class fields when evaluating them outside the class scope in the Console.
Chromium issues: 1483848, 1381806.
Lighthouse 11.1.0
The Lighthouse panel now runs Lighthouse 11.1.0. See the full list of changes.
To learn the basics of using the Lighthouse panel in DevTools, see Lighthouse: Optimize website speed.
Chromium issues: 772558.
Accessibility improvements
Screen readers will now read out the following:
- Warnings and errors in the Console.
- The text in the Do you trust this code? dialog when pasting code to Console or Sources.
Additionally, the Application panel fixed contrast issues with links in high contrast mode.
Chromium issues: 1485257, 1486643, 1485263.
Web SQL deprecation
The Application > Web SQL section will be removed in Chrome 123 because the Web SQL Database API isn't maintained anymore. This version adds a warning to the section about the upcoming removal.

For more information, see Deprecating and removing Web SQL.
Chromium issues: 1485966.
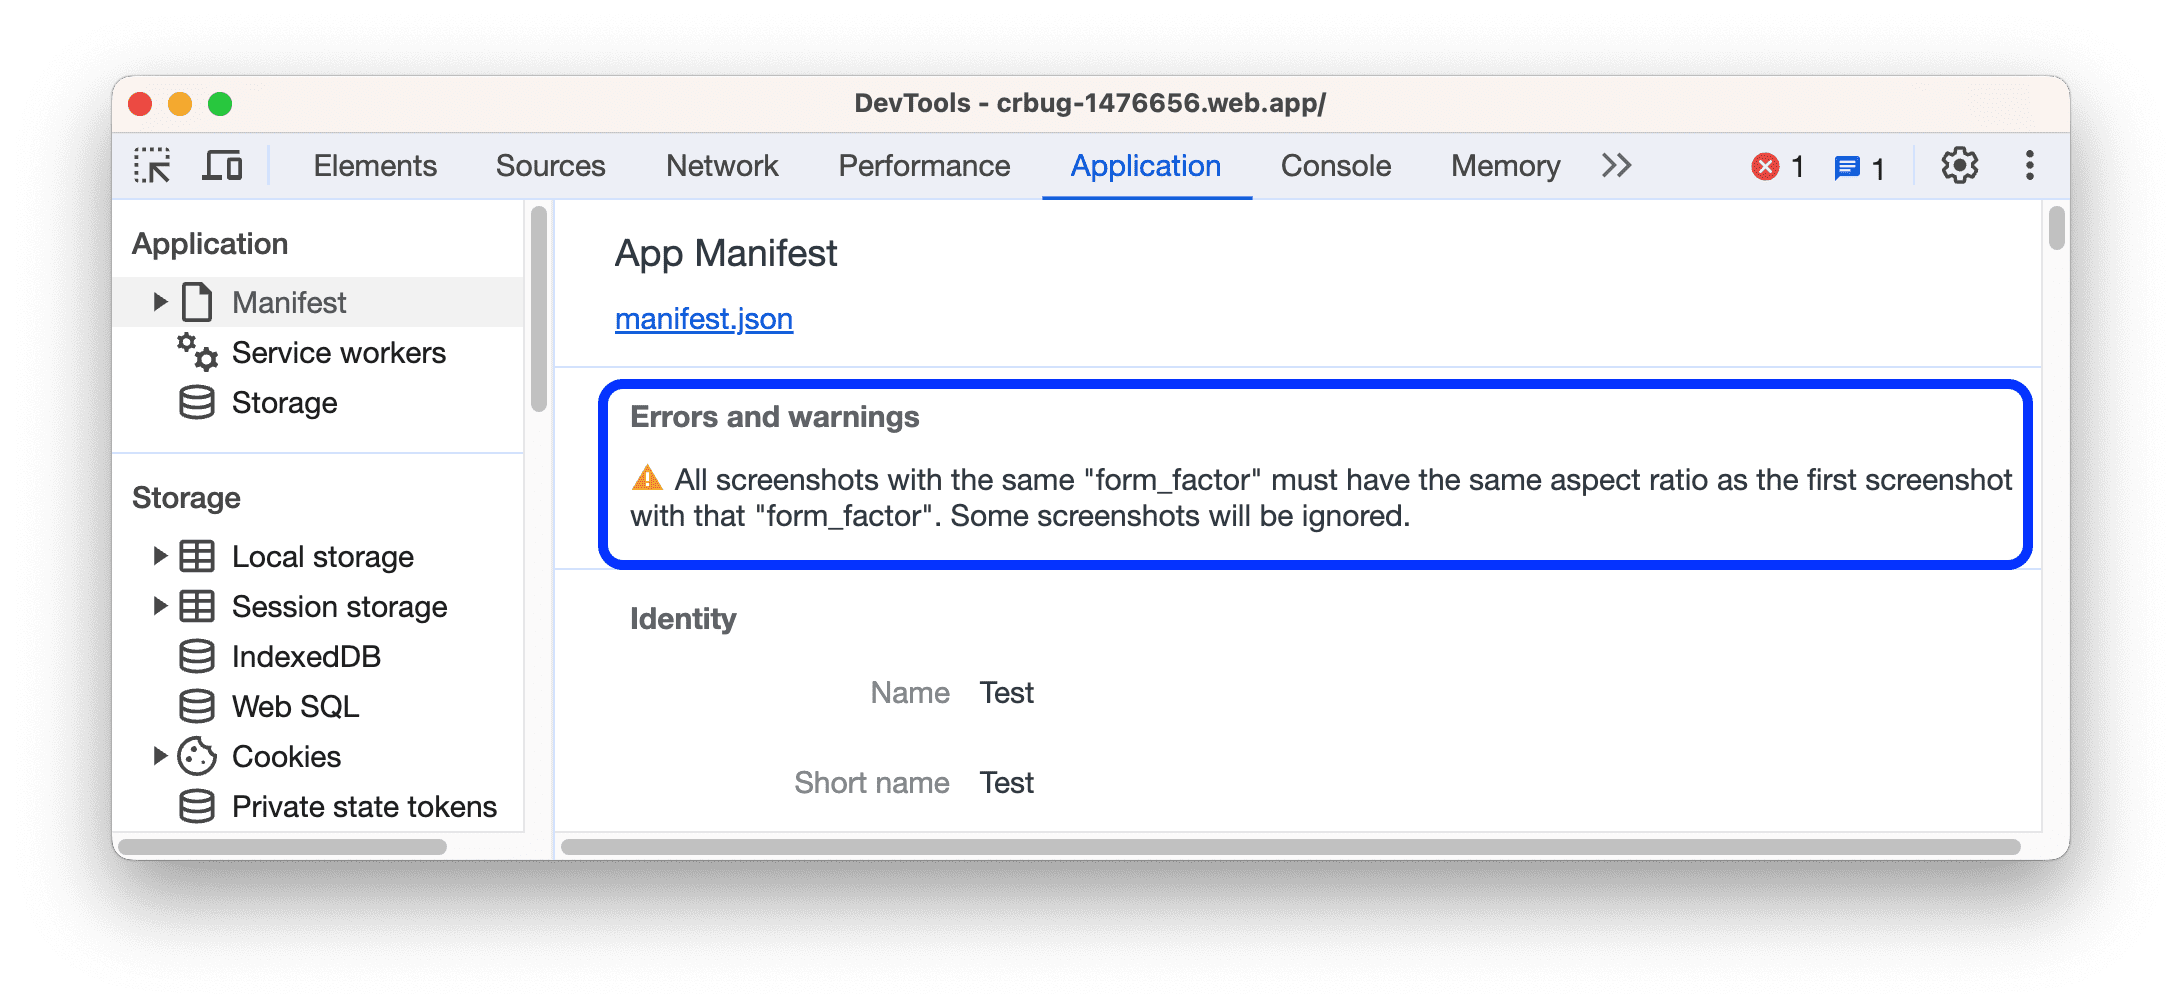
Screenshot aspect ratio validation in Application > Manifest
The Application > Manifest section now checks if your web app's screenshots with the same form factor (wide or narrow) have the same aspect ratio.
For more information, see Debug Progressive Web Apps and Add a web app manifest.
The DevTools team expresses gratitude to Alexey Rodionov for landing this change and other manifest warning improvements in the previous version.
Chromium issue: 1476656.
Miscellaneous highlights
These are some noteworthy fixes and improvements in this release:
- Elements:
- Animation timing function swatches are not shown for longhand CSS properties under the expandable shorthand ones (1149182).
- The autocomplete for
contain-intrinsic-*now doesn't provide the incorrect singleautovalue because it should beauto <length>(1480415). - Support for deprecated and invalid
-webkit-*properties has been removed (1086089, 1030765).
- Breakpoints: Fixed the bug with disappearing breakpoint editing dialog when the breakpoint type is changed (1485782).
- Performance:
- Network: The Set cookies column now shows the correct number of cookies that are set, excluding blocked (1486903).
- DevTools extensions now load after navigation to a non-blocked host (1476264).
- Fixed the bug with incorrect script execution context for extensions (1275331).
Download the preview channels
Consider using the Chrome Canary, Dev, or Beta as your default development browser. These preview channels give you access to the latest DevTools features, let you test cutting-edge web platform APIs, and help you find issues on your site before your users do!
Get in touch with the Chrome DevTools team
Use the following options to discuss the new features, updates, or anything else related to DevTools.
- Submit feedback and feature requests to us at crbug.com.
- Report a DevTools issue using the More options > Help > Report a DevTools issue in DevTools.
- Tweet at @ChromeDevTools.
- Leave comments on What's new in DevTools YouTube videos or DevTools Tips YouTube videos.
What's new in DevTools
A list of everything that has been covered in the What's new in DevTools series.
- DevTools MCP server updates
- Improved trace sharing
- Support for @starting-style
- Editor widget for display: masonry
- Lighthouse 13
- Code suggestions from Gemini
- Enhancements for the DevTools MCP server
- Quicker access to AI assistance
- Debug the full performance trace with Gemini
- Toggle drawer orientation
- Google Developer Program
- Miscellaneous highlights
- Chrome DevTools (MCP) for your AI agent
- Debug the network dependency tree with Gemini
- Export your chats with Gemini
- Persisted track configuration in the Performance panel
- Filter IP protected network requests
- Elements > Layout tab adds masonry layout support
- Lighthouse 12.8.2
- Miscellaneous highlights
- Debug more insights with Gemini
- Emulate the 'Save-Data' header in 'Network conditions'
- See the Baseline status in a CSS property tooltip
- Override form factors in user agent client hints
- Lighthouse 12.8.0
- Miscellaneous highlights
- A more reliable and productive Chrome DevTools
- Upload images in AI assistance for styling
- Add request headers to the table in Network
- Check out the highlights from Google I/O 2025
- Miscellaneous highlights
- Performance panel improvements
- Preconnected origins in 'Network dependency tree' insight
- Server response and redirection times in 'Document request latency' insight
- Redirects in Summary of network requests
- Reduced noise in the performance trace
- Deprecated 'Disable JavaScript samples'
- Geolocation accuracy parameter in Sensors
- Elements panel improvements
- Debug complex CSS values easier
- @function support in Elements > Styles
- Network panel improvements
- has-request-header filter
- Direct Sockets in Isolated Web Apps
- Miscellaneous highlights
- Accessibility
- Google I/O 2025 edition
- Modify and save CSS changes to your workspace with Gemini
- Connect a workspace folder and save changes back to your source files
- Ask Gemini about performance insights
- Annotate performance findings with Gemini
- Add screenshots to your chats with Gemini
- New insights in the Performance panel
- Duplicated JavaScript
- Legacy JavaScript
- Speculations now support rule tags
- Lighthouse 12.6.0
- Miscellaneous highlights
- Accessibility
- Performance panel improvements
- New performance insights
- Click to highlight
- Server timings in Summary of network requests
- Filter cookies in 'Privacy and security'
- Sizes in kB units in tables across panels
- Autocomplete supports corner-shape and corner-*-shape in Elements > Styles
- Experimental: Highlighting issues with elements and attributes in DOM
- Lighthouse 12.5.0
- Miscellaneous highlights
- Performance panel improvements
- Origin and script links for profile and function calls in Performance
- LCP by phase field data support
- Network dependency tree insight
- Duration instead of total and self time in Summary
- Heaviest stack highlighting
- Improved empty states for various panels
- Accessibility tree view in Elements
- Lighthouse 12.4.0
- Miscellaneous highlights
- Privacy and security panel
- Performance panel improvements
- Calibrated CPU throttling presets
- Select different performance events in the same AI chat
- First- and third-party highlighting in Performance
- Field data in marker tooltips and insights
- Forced reflow insight
- 'Optimize DOM size' insight
- Extend the performance trace with console.timeStamp
- Elements panel improvements
- Real-time values of animated styles
- Support for :open pseudo-class and various pseudo-elements
- Copy all console messages
- Byte units in the Memory panel
- Miscellaneous highlights
- Persistent AI chat history
- Performance panel improvements
- Image delivery insight
- Classic and modern keyboard navigation
- Ignore irrelevant scripts in the flame chart
- Timeline marker and range highlighting on hover
- Recommended throttling settings
- Timings markers in an overlay
- Stack traces of JS calls in Summary
- Badge settings moved to menu in Elements
- New 'What's new' panel
- Lighthouse 12.3.0
- Miscellaneous highlights
- Debug network requests, source files, and performance traces with Gemini
- View AI chat history
- Manage extension storage in Application > Storage
- Performance improvements
- Interaction phases in live metrics
- Render blocking information in the Summary tab
- Support for scheduler.postTask events and their initiator arrows
- Animations panel and Elements > Styles tab improvements
- Jump from Elements > Styles to Animations
- Real-time updates in Computed tab
- Compute pressure emulation in Sensors
- JS objects with the same name grouped by source in the Memory panel
- A new look for settings
- Performance insights panel is deprecated and removed from DevTools
- Miscellaneous highlights
- Debug CSS with Gemini
- Control AI features in a dedicated settings tab
- Performance panel improvements
- Annotate and share performance findings
- Get performance insights right in the Performance panel
- Spot excessive layout shifts easier
- Spot the non-composited animations
- Hardware concurrency moves to Sensors
- Ignore anonymous scripts and focus on your code in stack traces
- Elements > Styles: Support for sideways-* writing modes for grid overlays and CSS-wide keywords
- Lighthouse audits for non-HTTP pages in timespan and snapshot modes
- Accessibility improvements
- Miscellaneous highlights
- Network panel improvements
- Network filters reimagined
- HAR exports now exclude sensitive data by default
- Elements panel improvements
- Autocomplete values for text-emphasis-* properties
- Scroll overflows marked with a badge
- Performance panel improvements
- Recommendations in live metrics
- Navigate breadcrumbs
- Memory panel improvements
- New 'Detached elements' profile
- Improved naming of plain JS objects
- Turn off dynamic theming
- Chrome Experiment: Process sharing
- Lighthouse 12.2.1
- Miscellaneous highlights
- Recorder supports export to Puppeteer for Firefox
- Performance panel improvements
- Live metrics observations
- Search requests in the Network track
- See stack traces of performance.mark and performance.measure calls
- Use test address data in the Autofill panel
- Elements panel improvements
- Force more states for specific elements
- Elements > Styles now autocompletes more grid properties
- Lighthouse 12.2.0
- Miscellaneous highlights
- Console insights by Gemini are going live in most European countries
- Performance panel updates
- Enhanced Network track
- Customize performance data with extensibility API
- Details in the Timings track
- Copy all listed requests in the Network panel
- Faster heap snapshots with named HTML tags and less clutter
- Open Animations panel to capture animations and edit @keyframes live
- Lighthouse 12.1.0
- Accessibility improvements
- Miscellaneous highlights
- Inspect CSS anchor positioning in the Elements panel
- Sources panel improvements
- Enhanced 'Never Pause Here'
- New scroll snap event listeners
- Network panel improvements
- Updated network throttling presets
- Service worker information in custom fields of the HAR format
- Send and receive WebSocket events in the Performance panel
- Miscellaneous highlights
- Performance panel improvements
- Move and hide tracks with updated track configuration mode
- Ignore scripts in the flame chart
- Throttle down the CPU by 20 times
- Performance insights panel will be deprecated
- Find excessive memory usage with new filters in heap snapshots
- Inspect storage buckets in Application > Storage
- Disable self-XSS warnings with a command-line flag
- Lighthouse 12.0.0
- Miscellaneous highlights
- Understand errors and warnings in the Console better with Gemini
- @position-try rules support in Elements > Styles
- Sources panel improvements
- Configure automatic pretty-printing and bracket closing
- Handled rejected promises are recognized as caught
- Error causes in the Console
- Network panel improvements
- Inspect Early Hints headers
- Hide the Waterfall column
- Performance panel improvements
- Capture CSS selector statistics
- Change order and hide tracks
- Ignore retainers in the Memory panel
- Lighthouse 11.7.1
- Miscellaneous highlights
- New Autofill panel
- Enhanced network throttling for WebRTC
- Scroll-driven animations support in the Animations panel
- Improved CSS nesting support in Elements > Styles
- Enhanced Performance panel
- Hide functions and their children in the flame chart
- Arrows from selected initiators to events they initiated
- Lighthouse 11.6.0
- Tooltips for special categories in Memory > Heap snapshots
- Application > Storage updates
- Bytes used for shared storage
- Web SQL is fully deprecated
- Coverage panel improvements
- The Layers panel might be deprecated
- JavaScript Profiler deprecation: Phase four, final
- Miscellaneous highlights
- Find the Easter egg
- Elements panel updates
- Emulate a focused page in Elements > Styles
- Color Picker, Angle Clock, and Easing Editor in
var()fallbacks - CSS length tool is deprecated
- Popover for the selected search result in the Performance > Main track
- Network panel updates
- Clear button and search filter in the Network > EventStream tab
- Tooltips with exemption reasons for third-party cookies in Network > Cookies
- Enable and disable all breakpoints in Sources
- View loaded scripts in DevTools for Node.js
- Lighthouse 11.5.0
- Accessibility improvements
- Miscellaneous highlights
- The official collection of Recorder extensions is live
- Network improvements
- Failure reason in the Status column
- Improved Copy submenu
- Performance improvements
- Breadcrumbs in the Timeline
- Event initiators in the Main track
- JavaScript VM instance selector menu for Node.js DevTools
- New shortcut and command in Sources
- Elements improvements
- The ::view-transition pseudo-element is now editable in Styles
- The align-content property support for block containers
- Posture support for emulated foldable devices
- Dynamic theming
- Third-party cookies phaseout warnings in the Network and Application panels
- Lighthouse 11.4.0
- Accessibility improvements
- Miscellaneous highlights
- Elements improvements
- Streamlined filter bar in the Network panel
@font-palette-valuessupport- Supported case: Custom property as a fallback of another custom property
- Improved source map support
- Performance panel improvements
- Enhanced Interactions track
- Advanced filtering in Bottom-Up, Call Tree, and Event Log tabs
- Indentation markers in the Sources panel
- Helpful tooltips for overridden headers and content in the Network panel
- New Command Menu options for adding and removing request blocking patterns
- The CSP violations experiment is removed
- Lighthouse 11.3.0
- Accessibility improvements
- Miscellaneous highlights
- Third-party cookie phaseout
- Analyze your website's cookies with the Privacy Sandbox Analysis Tool
- Enhanced ignore listing
- Default exclusion pattern for node_modules
- Caught exceptions now stop execution if caught or passing through non-ignored code
x_google_ignoreListrenamed toignoreListin source maps- New input mode toggle during remote debugging
- The Elements panel now shows URLs for #document nodes
- Effective Content Security Policy in the Application panel
- Improved animation debugging
- 'Do you trust this code?' dialog in Sources and self-XSS warning in Console
- Event listener breakpoints in web workers and worklets
- The new media badge for
<audio>and<video> - Preloading renamed to Speculative loading
- Lighthouse 11.2.0
- Accessibility improvements
- Miscellaneous highlights
- Improved @property section in Elements > Styles
- Editable @property rule
- Issues with invalid @property rules are reported
- Updated list of devices to emulate
- Pretty-print inline JSON in script tags in Sources
- Autocomplete private fields in Console
- Lighthouse 11.1.0
- Accessibility improvements
- Web SQL deprecation
- Screenshot aspect ratio validation in Application > Manifest
- Miscellaneous highlights
- New section for custom properties in Elements > Styles
- More local overrides improvements
- Enhanced search
- Improved Sources panel
- Streamlined workspace in the Sources panel
- Reorder panes in Sources
- Syntax highlighting and pretty-printing for more script types
- Emulate prefers-reduced-transparency media feature
- Lighthouse 11
- Accessibility improvements
- Miscellaneous highlights
- Network panel improvements
- Override web content locally even faster
- Override the content of XHR and fetch requests
- Hide Chrome extension requests
- Human-readable HTTP status codes
Performance: See the changes in fetch priority for network events
- Sources settings enabled by default: Code folding and automatic file reveal
- Improved debugging of third-party cookie issues
- New colors
- Lighthouse 10.4.0
- Debug preloading in the Application panel
- The C/C++ WebAssembly debugging extension for DevTools is now open source
- Miscellaneous highlights
- (Experimental) New rendering emulation: prefers-reduced-transparency
- (Experimental) Enhanced Protocol monitor
- Improved debugging of missing stylesheets
- Linear timing support in Elements > Styles > Easing Editor
- Storage buckets support and metadata view
- Lighthouse 10.3.0
- Accessibility: Keyboard commands and improved screen reading
- Miscellaneous highlights
- Elements improvements
- New CSS subgrid badge
- Selector specificity in tooltips
- Values of custom CSS properties in tooltips
- Sources improvements
- CSS syntax highlighting
- Shortcut to set conditional breakpoints
- Application > Bounce Tracking Mitigations
- Lighthouse 10.2.0
- Ignore content scripts by default
- Network > Response improvements
- Miscellaneous highlights
- WebAssembly debugging support
- Improved stepping behavior in Wasm apps
- Debug Autofill using the Elements panel and Issues tab
- Assertions in Recorder
- Lighthouse 10.1.1
- Performance enhancements
- performance.mark() shows timing on hover in Performance > Timings
- profile() command populates Performance > Main
- Warning for slow user interactions
- Web Vitals updates
- JavaScript Profiler deprecation: Phase three
- Miscellaneous highlights
- Override network response headers
- Nuxt, Vite, and Rollup debugging improvements
- CSS improvements in Elements > Styles
- Invalid CSS properties and values
- Links to key frames in the animation shorthand property
- New Console setting: Autocomplete on Enter
- Command Menu emphasizes authored files
- JavaScript Profiler deprecation: Stage two
- Miscellaneous highlights
- Recorder updates
- Recorder replay extensions
- Record with pierce selectors
- Export recordings as Puppeteer scripts with Lighthouse analysis
- Get extensions for Recorder
- Elements > Styles updates
- CSS documentation in the Styles pane
- CSS nesting support
- Marking logpoints and conditional breakpoints in the Console
- Ignore irrelevant scripts during debugging
- JavaScript Profiler deprecation started
- Emulate reduced contrast
- Lighthouse 10
- Miscellaneous highlights
- Debugging HD color with the Styles pane
- Enhanced breakpoint UX
- Customizable Recorder shortcuts
- Better syntax highlight for Angular
- Reorganize caches in the Application panel
- Miscellaneous highlights
- Clearing Performance Panel on reload
- Recorder updates
- View and highlight the code of your user flow in the Recorder
- Customize selector types of a recording
- Edit user flow while recording
- Automatic in-place pretty print
- Better syntax highlight and inline preview for Vue, SCSS and more
- Ergonomic and consistent Autocomplete in the Console
- Miscellaneous highlights
- Recorder: Copy as options for steps, in-page replay, step's context menu
- Show actual function names in performance's recordings
- New keyboard shortcuts in the Console & Sources panel
- Improved JavaScript debugging
- Miscellaneous highlights
- [Experimental] Enhanced UX in managing breakpoints
- [Experimental] Automatic in-place pretty print
- Hints for inactive CSS properties
- Auto-detect XPath and text selectors in the Recorder panel
- Step through comma-separated expressions
- Improved Ignore list setting
- Miscellaneous highlights
- Customize keyboard shortcuts in DevTools
- Toggle light and dark themes with keyboard shortcut
- Highlight C/C++ objects in the Memory Inspector
- Support full initiator information for HAR import
- Start DOM search after pressing
Enter - Display
startandendicons foralign-contentCSS flexbox properties - Miscellaneous highlights
- Group files by Authored / Deployed in the Sources panel
- Linked stack traces for asynchronous operations
- Automatically ignore known third-party scripts
- Improved call stack during debugging
- Hiding ignore-listed sources in the Sources panel
- Hiding ignore-listed files in the Command Menu
- New Interactions track in the Performance panel
- LCP timings breakdown in the Performance Insights panel
- Auto-generate default name for recordings in the Recorder panel
- Miscellaneous highlights
- Step-by-step replay in the Recorder
- Support mouse over event in the Recorder panel
- Largest Contentful Paint (LCP) in the Performance insights panel
- Identify flashes of text (FOIT, FOUT) as potential root causes for layout shifts
- Protocol handlers in the Manifest pane
- Top layer badge in the Elements panel
- Attach Wasm debugging information at runtime
- Support live edit during debugging
- View and edit @scope at rules in the Styles pane
- Source map improvements
- Miscellaneous highlights
- Restart frame during debugging
- Slow replay options in the Recorder panel
- Build an extension for the Recorder panel
- Group files by Authored / Deployed in the Sources panel
- New User Timings track in the Performance insights panel
- Reveal assigned slot of an element
- Simulate hardware concurrency for Performance recordings
- Preview non-color value when autocompleting CSS variables
- Identify blocking frames in the Back/forward cache pane
- Improved autocomplete suggestions for JavaScript objects
- Source maps improvements
- Miscellaneous highlights
- Capture double-click and right-click events in the Recorder panel
- New timespan and snapshot mode in the Lighthouse panel
- Improved zoom control in the Performance Insights panel
- Confirm to delete a performance recording
- Reorder panes in the Elements panel
- Picking a color outside of the browser
- Improved inline value preview during debugging
- Support large blobs for virtual authenticators
- New keyboard shortcuts in the Sources panel
- Source maps improvements
- Preview feature: New Performance insights panel
- New shortcuts to emulate light and dark themes
- Improved security on the Network Preview tab
- Improved reloading at breakpoint
- Console updates
- Cancel user flow recording at the start
- Display inherited highlight pseudo-elements in the Styles pane
- Miscellaneous highlights
- [Experimental] Copy CSS changes
- [Experimental] Picking color outside of browser
- Import and export recorded user flows as a JSON file
- View cascade layers in the Styles pane
- Support for the
hwb()color function - Improved the display of private properties
- Miscellaneous highlights
- [Experimental] New timespan and snapshot mode in the Lighthouse panel
- View and edit @supports at rules in the Styles pane
- Support common selectors by default
- Customize the recording's selector
- Rename a recording
- Preview class/function properties on hover
- Partially presented frames in the Performance panel
- Miscellaneous highlights
- Throttling WebSocket requests
- New Reporting API pane in the Application panel
- Support wait until element is visible/clickable in the Recorder panel
- Better console styling, formatting and filtering
- Debug Chrome extension with source map files
- Improved source folder tree in the Sources panel
- Display worker source files in the Sources panel
- Chrome's Auto Dark Theme updates
- Touch-friendly color-picker and split pane
- Miscellaneous highlights
- Preview feature: Full-page accessibility tree
- More precise changes in the Changes tab
- Set longer timeout for user flow recording
- Ensure your pages are cacheable with the Back/forward cache tab
- New Properties pane filter
- Emulate the CSS forced-colors media feature
- Show rulers on hover command
- Support
row-reverseandcolumn-reversein the Flexbox editor - New keyboard shortcuts to replay XHR and expand all search results
- Lighthouse 9 in the Lighthouse panel
- Improved Sources panel
- Miscellaneous highlights
- [Experimental] Endpoints in the Reporting API pane
- Preview feature: New Recorder panel
- Refresh device list in Device Mode
- Autocomplete with Edit as HTML
- Improved code debugging experience