
Streamlined filter bar in the Network panel
The filter bar is redesigned to let you filter requests easier and declutter the Network panel.
The corresponding experiment was turned on by default in this version but will be reverted. You can track the progress in crbug.com/1523150.
The new filter bar has two drop-down menus: one for choosing request types and another for hiding data and extension URLs or only showing blocked cookies and requests, and third-party requests. Both menus support multi-select.
To bring back the old filter bar immediately, turn off Settings > Experiments > Redesign of the filter bar in the Network panel.

Feel free to leave your feedback about the feature in crbug.com/1500573.
Chromium issue: 1486431.
Elements improvements
@font-palette-values support
The Elements panel now supports the @font-palette-values CSS at-rule. It lets you customize the default values of the font-palette property.
In Styles, click the value of the font-palette property and DevTools takes you to the @font-palette-values dedicated section where you can edit your custom values.

Chromium issue: 1501781.
Supported case: Custom property as a fallback of another custom property
Elements > Styles now resolves a custom property that is a fallback of another custom property.

Chromium issue: 1499265.
Improved source map support
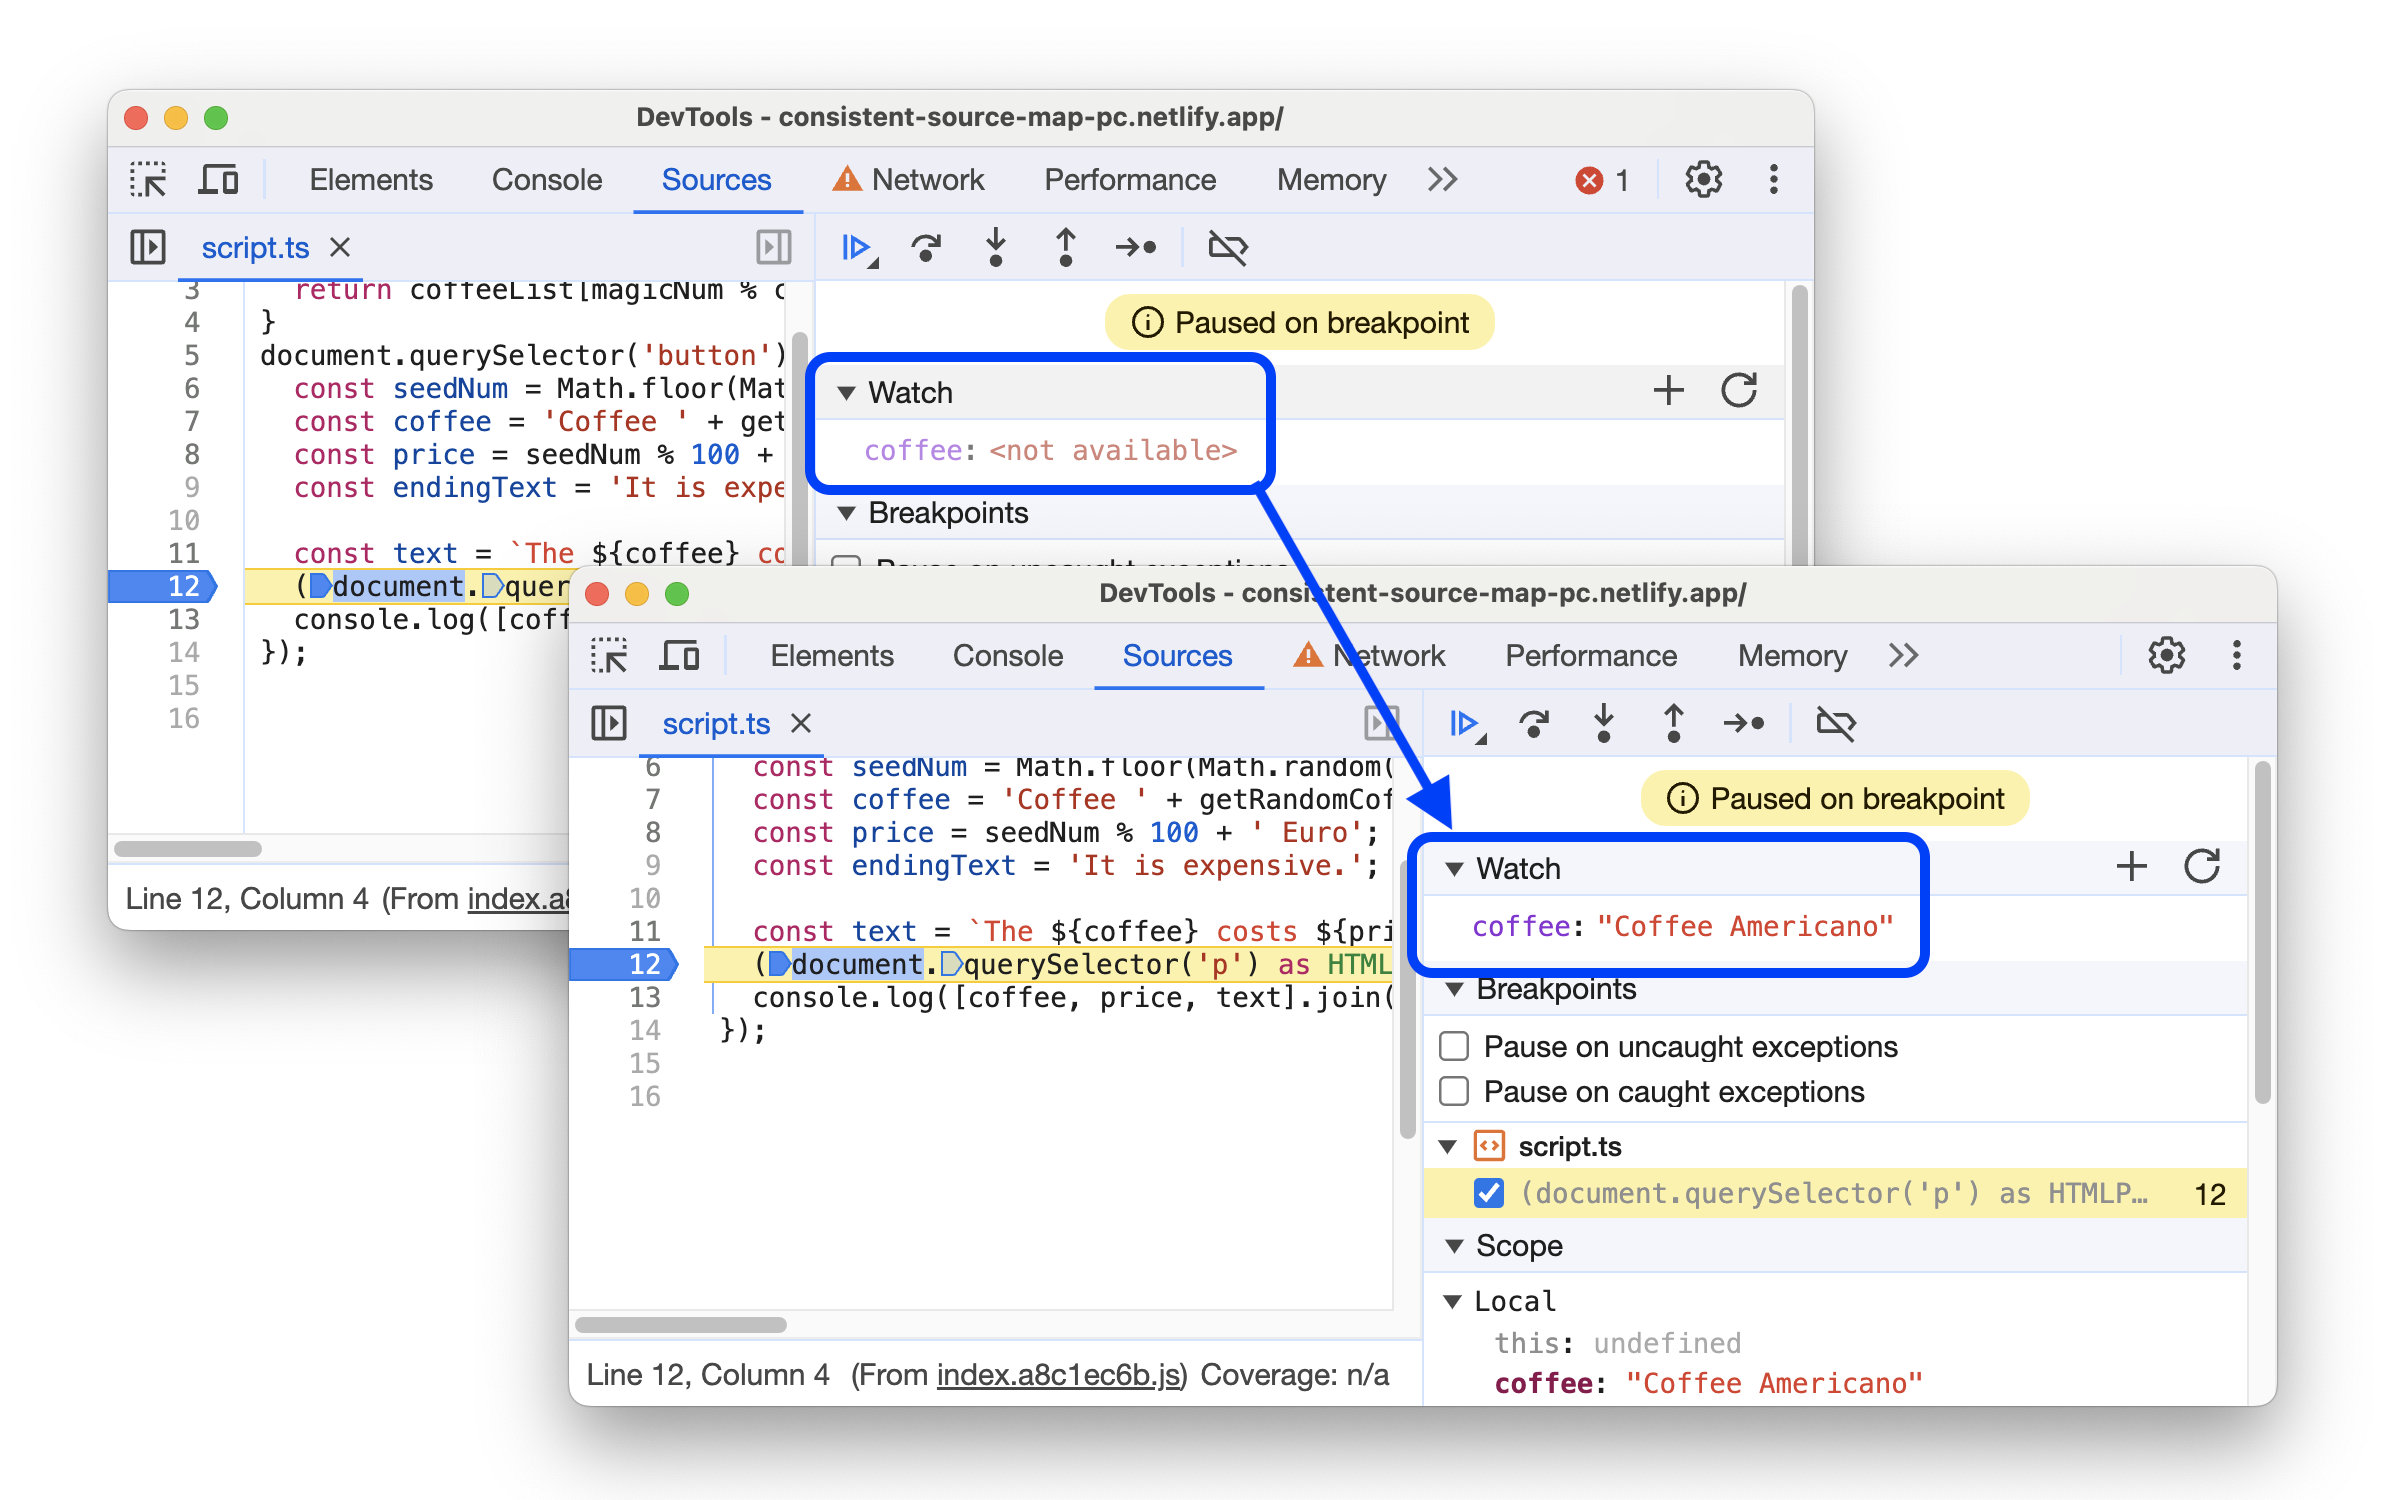
The Settings > Experiments > Resolve variable names in expressions using source maps has been turned on by default.
DevTools uses source maps to let you debug your original code in Sources and Scope even after you've combined, minified, or compiled it. This experiment lets you evaluate your original variable names consistently across DevTools, including but not limited to:
Expressions in the Console and autocomplete suggestions
-
-
Conditional breakpoints and logpoints


For more details, see the corresponding RFC.
Chromium issue: 1444349.
Performance panel improvements
Enhanced Interactions track
The Performance > Interactions track gets whiskers that indicate input and presentation delays at processing time boundaries.
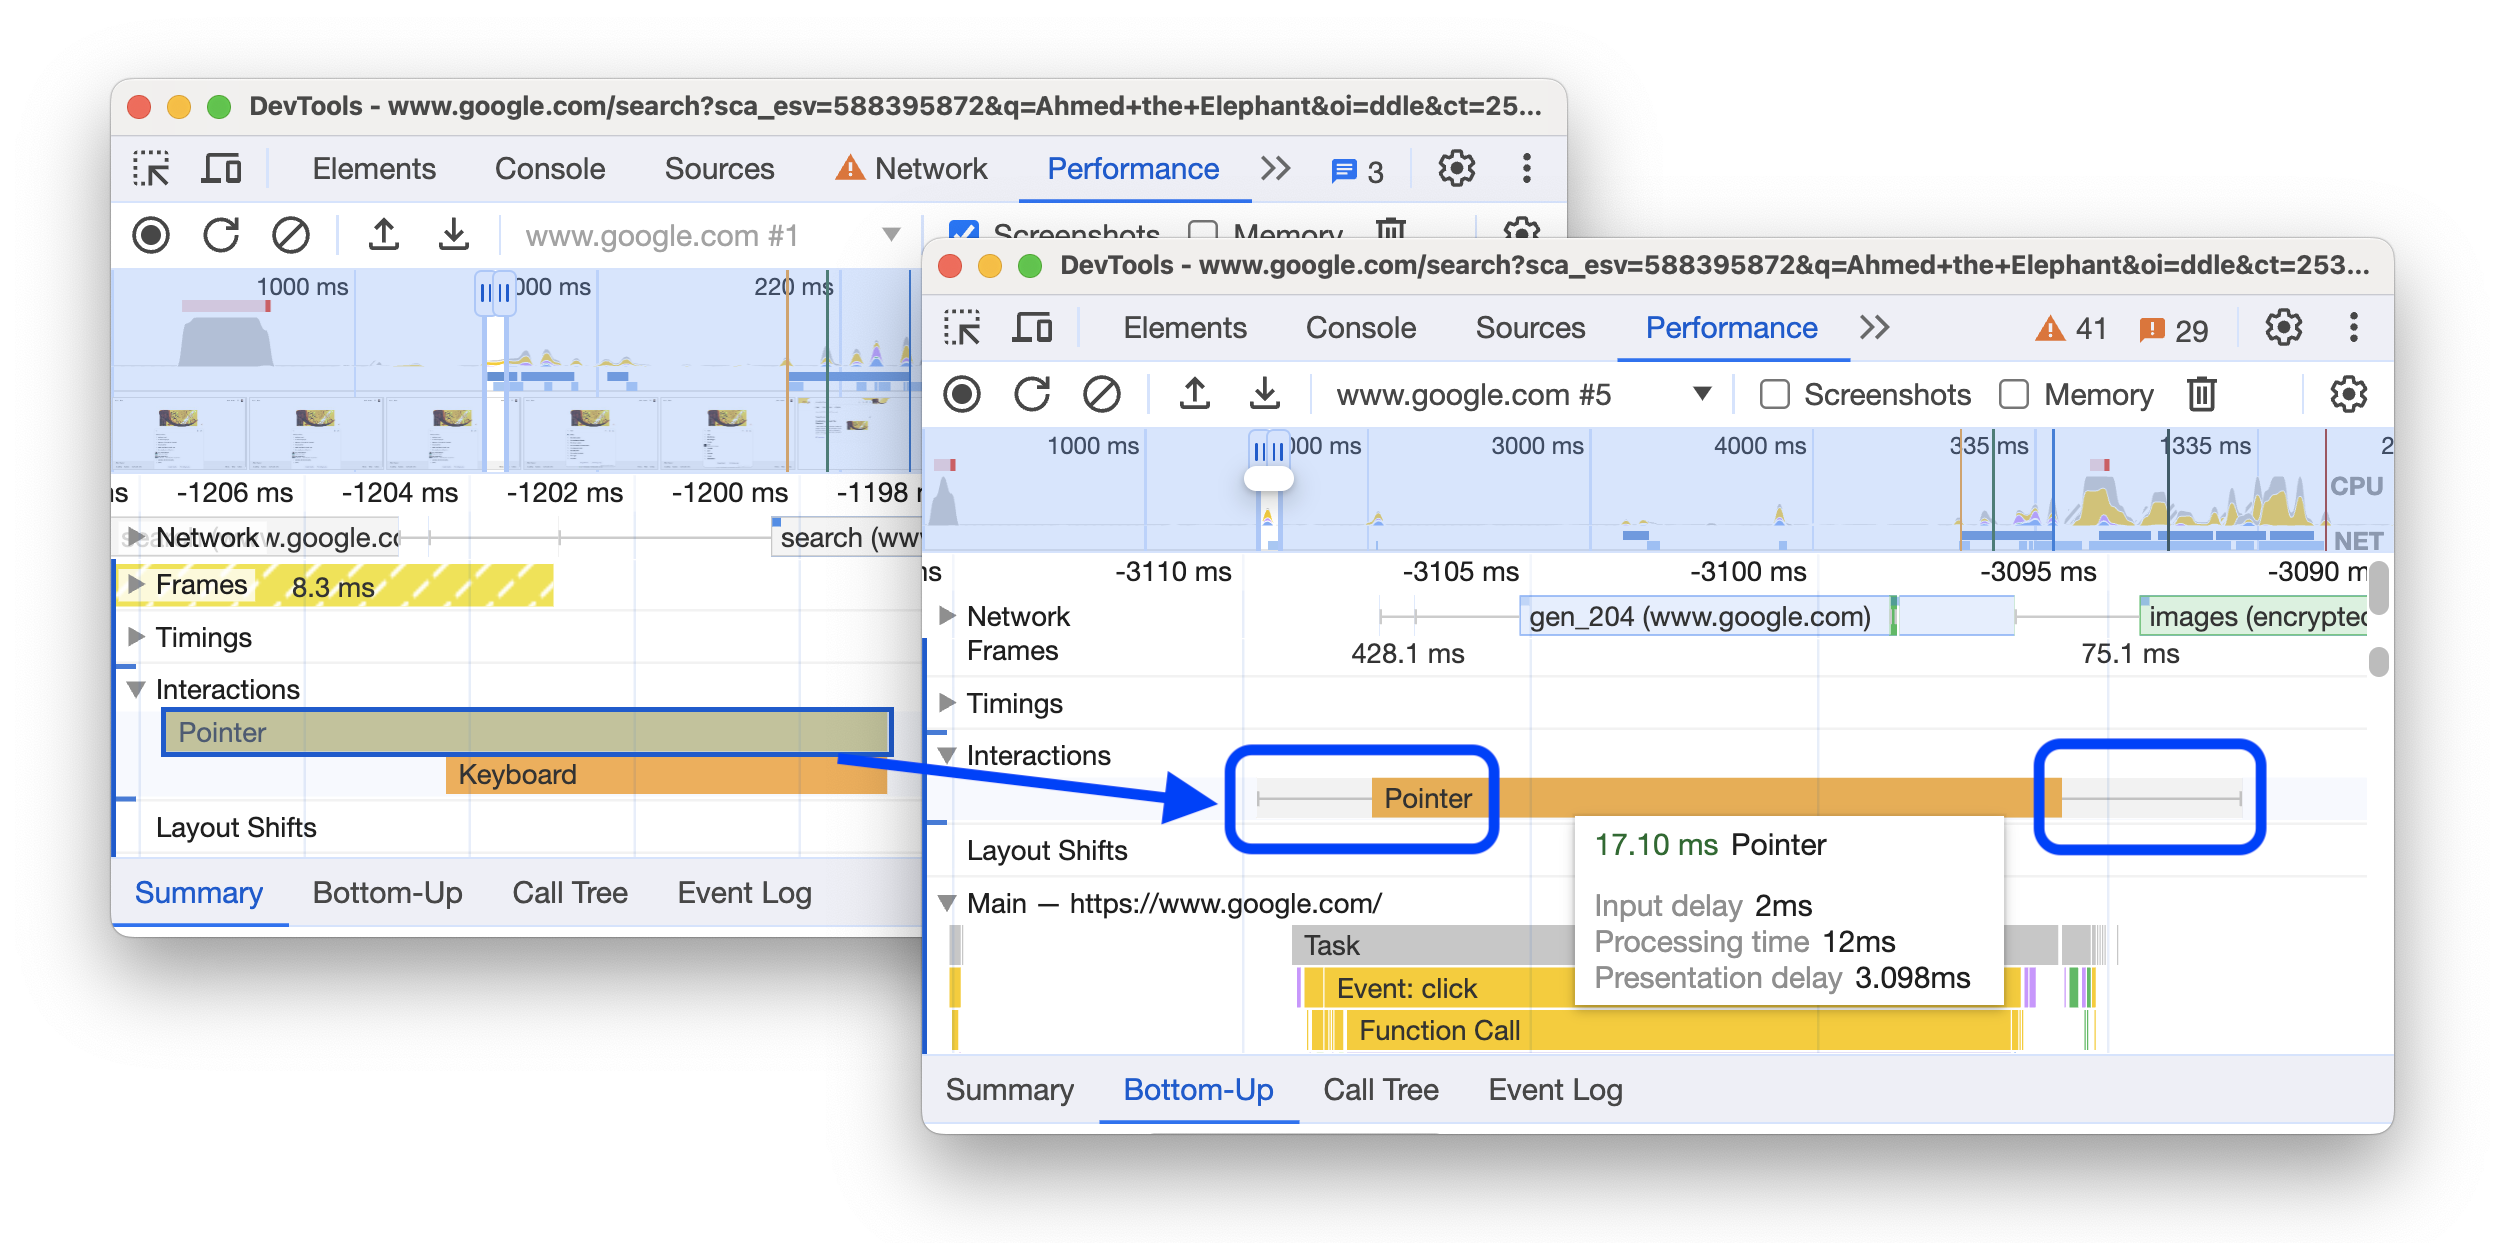
Additionally, when you hover over an interaction, you can see a helpful tooltip detailing timings.
Chromium issue: 1495751.
Advanced filtering in Bottom-Up, Call Tree, and Event Log tabs
The Bottom-Up, Call Tree, and Event Log tabs in the Performance panel got three new buttons for advanced filtering:
- Match case.
- Regular expression.
- Match whole word.

Additionally, to help you retain context, now only top level items match the filter in the Bottom-Up tab. Previously, the filter matched every node.
Chromium issue: 1496355.
Indentation markers in the Sources panel
The Editor in the Sources panel now marks indented code blocks with vertical lines for your convenience.

Chromium issue: 1479986.
Helpful tooltips for overridden headers and content in the Network panel
The Network panel now shows tooltips when you hover over the purple dot icon next to Headers and Response tabs of a request. The tooltips tell you what was overridden by DevTools.

Chromium issue: 1469776.
New Command Menu options for adding and removing request blocking patterns
You can now type commands to add or remove network request blocking patterns into the Command Menu.

The Add command takes you to the dialog to specify the pattern and the Remove command removes all patterns without opening the Network request blocking panel.
The CSP violations experiment is removed
The experimental CSP violations tab introduced in version 89 has been removed as redundant.
To see CSP details at a glance, navigate to Application > Frames > Content Security Policy (CSP).

Additionally, the Issues panel reports CSP violations.

Lighthouse 11.3.0
The Lighthouse panel now runs Lighthouse 11.3.0. See the full list of changes. Among notable changes is the ability to run reports on 404 pages.
To learn the basics of using the Lighthouse panel in DevTools, see Lighthouse: Optimize website speed.
Chromium issue: 772558.
Accessibility
This version has the following accessibility improvements:
- In Network > Payload, you can now tab-focus the view source and view URL-encoded buttons and press Enter or Space to trigger the corresponding action.
- In Console, to reduce confusion, the links that lead to scripts that are no longer available to the Debugger are now grayed out and can't be clicked.
- In navigation trees, such as the tree in Sources > Page, the Enter key now expands and collapses nodes with children.
Chromium issues: 1338391, 1500662, 1420362.
Miscellaneous highlights
These are some noteworthy fixes and improvements in this release:
- Performance. If a recording fails, you now have the option to Download raw trace events and try to figure out what went wrong (commit).
- The Show Console shortcut (Ctrl+` for Mac, Ctrl++ for Windows and Linux) now not only opens the Console but also closes when pressed a second time.
- Developer Resources. Fixed a bug that prevented reporting CSS resources and their issues (1420362).
- Elements:
- Console. Now correctly parses regular expressions that end with an escaped character in the Filter box (1346936).
- Settings > Workspace. Fixed a bug that prevented adding an excluded folder (1503580).
- Network > Preview. Now renders images with
data:URIs (1381791). - Memory. Added proper load and save buttons to the action bar (1275407).
Download the preview channels
Consider using the Chrome Canary, Dev, or Beta as your default development browser. These preview channels give you access to the latest DevTools features, let you test cutting-edge web platform APIs, and help you find issues on your site before your users do!
Get in touch with the Chrome DevTools team
Use the following options to discuss the new features, updates, or anything else related to DevTools.
- Submit feedback and feature requests to us at crbug.com.
- Report a DevTools issue using the More options > Help > Report a DevTools issue in DevTools.
- Tweet at @ChromeDevTools.
- Leave comments on What's new in DevTools YouTube videos or DevTools Tips YouTube videos.
What's new in DevTools
A list of everything that has been covered in the What's new in DevTools series.
- DevTools MCP server updates
- Improved trace sharing
- Support for @starting-style
- Editor widget for display: masonry
- Lighthouse 13
- Code suggestions from Gemini
- Enhancements for the DevTools MCP server
- Quicker access to AI assistance
- Debug the full performance trace with Gemini
- Toggle drawer orientation
- Google Developer Program
- Miscellaneous highlights
- Chrome DevTools (MCP) for your AI agent
- Debug the network dependency tree with Gemini
- Export your chats with Gemini
- Persisted track configuration in the Performance panel
- Filter IP protected network requests
- Elements > Layout tab adds masonry layout support
- Lighthouse 12.8.2
- Miscellaneous highlights
- Debug more insights with Gemini
- Emulate the 'Save-Data' header in 'Network conditions'
- See the Baseline status in a CSS property tooltip
- Override form factors in user agent client hints
- Lighthouse 12.8.0
- Miscellaneous highlights
- A more reliable and productive Chrome DevTools
- Upload images in AI assistance for styling
- Add request headers to the table in Network
- Check out the highlights from Google I/O 2025
- Miscellaneous highlights
- Performance panel improvements
- Preconnected origins in 'Network dependency tree' insight
- Server response and redirection times in 'Document request latency' insight
- Redirects in Summary of network requests
- Reduced noise in the performance trace
- Deprecated 'Disable JavaScript samples'
- Geolocation accuracy parameter in Sensors
- Elements panel improvements
- Debug complex CSS values easier
- @function support in Elements > Styles
- Network panel improvements
- has-request-header filter
- Direct Sockets in Isolated Web Apps
- Miscellaneous highlights
- Accessibility
- Google I/O 2025 edition
- Modify and save CSS changes to your workspace with Gemini
- Connect a workspace folder and save changes back to your source files
- Ask Gemini about performance insights
- Annotate performance findings with Gemini
- Add screenshots to your chats with Gemini
- New insights in the Performance panel
- Duplicated JavaScript
- Legacy JavaScript
- Speculations now support rule tags
- Lighthouse 12.6.0
- Miscellaneous highlights
- Accessibility
- Performance panel improvements
- New performance insights
- Click to highlight
- Server timings in Summary of network requests
- Filter cookies in 'Privacy and security'
- Sizes in kB units in tables across panels
- Autocomplete supports corner-shape and corner-*-shape in Elements > Styles
- Experimental: Highlighting issues with elements and attributes in DOM
- Lighthouse 12.5.0
- Miscellaneous highlights
- Performance panel improvements
- Origin and script links for profile and function calls in Performance
- LCP by phase field data support
- Network dependency tree insight
- Duration instead of total and self time in Summary
- Heaviest stack highlighting
- Improved empty states for various panels
- Accessibility tree view in Elements
- Lighthouse 12.4.0
- Miscellaneous highlights
- Privacy and security panel
- Performance panel improvements
- Calibrated CPU throttling presets
- Select different performance events in the same AI chat
- First- and third-party highlighting in Performance
- Field data in marker tooltips and insights
- Forced reflow insight
- 'Optimize DOM size' insight
- Extend the performance trace with console.timeStamp
- Elements panel improvements
- Real-time values of animated styles
- Support for :open pseudo-class and various pseudo-elements
- Copy all console messages
- Byte units in the Memory panel
- Miscellaneous highlights
- Persistent AI chat history
- Performance panel improvements
- Image delivery insight
- Classic and modern keyboard navigation
- Ignore irrelevant scripts in the flame chart
- Timeline marker and range highlighting on hover
- Recommended throttling settings
- Timings markers in an overlay
- Stack traces of JS calls in Summary
- Badge settings moved to menu in Elements
- New 'What's new' panel
- Lighthouse 12.3.0
- Miscellaneous highlights
- Debug network requests, source files, and performance traces with Gemini
- View AI chat history
- Manage extension storage in Application > Storage
- Performance improvements
- Interaction phases in live metrics
- Render blocking information in the Summary tab
- Support for scheduler.postTask events and their initiator arrows
- Animations panel and Elements > Styles tab improvements
- Jump from Elements > Styles to Animations
- Real-time updates in Computed tab
- Compute pressure emulation in Sensors
- JS objects with the same name grouped by source in the Memory panel
- A new look for settings
- Performance insights panel is deprecated and removed from DevTools
- Miscellaneous highlights
- Debug CSS with Gemini
- Control AI features in a dedicated settings tab
- Performance panel improvements
- Annotate and share performance findings
- Get performance insights right in the Performance panel
- Spot excessive layout shifts easier
- Spot the non-composited animations
- Hardware concurrency moves to Sensors
- Ignore anonymous scripts and focus on your code in stack traces
- Elements > Styles: Support for sideways-* writing modes for grid overlays and CSS-wide keywords
- Lighthouse audits for non-HTTP pages in timespan and snapshot modes
- Accessibility improvements
- Miscellaneous highlights
- Network panel improvements
- Network filters reimagined
- HAR exports now exclude sensitive data by default
- Elements panel improvements
- Autocomplete values for text-emphasis-* properties
- Scroll overflows marked with a badge
- Performance panel improvements
- Recommendations in live metrics
- Navigate breadcrumbs
- Memory panel improvements
- New 'Detached elements' profile
- Improved naming of plain JS objects
- Turn off dynamic theming
- Chrome Experiment: Process sharing
- Lighthouse 12.2.1
- Miscellaneous highlights
- Recorder supports export to Puppeteer for Firefox
- Performance panel improvements
- Live metrics observations
- Search requests in the Network track
- See stack traces of performance.mark and performance.measure calls
- Use test address data in the Autofill panel
- Elements panel improvements
- Force more states for specific elements
- Elements > Styles now autocompletes more grid properties
- Lighthouse 12.2.0
- Miscellaneous highlights
- Console insights by Gemini are going live in most European countries
- Performance panel updates
- Enhanced Network track
- Customize performance data with extensibility API
- Details in the Timings track
- Copy all listed requests in the Network panel
- Faster heap snapshots with named HTML tags and less clutter
- Open Animations panel to capture animations and edit @keyframes live
- Lighthouse 12.1.0
- Accessibility improvements
- Miscellaneous highlights
- Inspect CSS anchor positioning in the Elements panel
- Sources panel improvements
- Enhanced 'Never Pause Here'
- New scroll snap event listeners
- Network panel improvements
- Updated network throttling presets
- Service worker information in custom fields of the HAR format
- Send and receive WebSocket events in the Performance panel
- Miscellaneous highlights
- Performance panel improvements
- Move and hide tracks with updated track configuration mode
- Ignore scripts in the flame chart
- Throttle down the CPU by 20 times
- Performance insights panel will be deprecated
- Find excessive memory usage with new filters in heap snapshots
- Inspect storage buckets in Application > Storage
- Disable self-XSS warnings with a command-line flag
- Lighthouse 12.0.0
- Miscellaneous highlights
- Understand errors and warnings in the Console better with Gemini
- @position-try rules support in Elements > Styles
- Sources panel improvements
- Configure automatic pretty-printing and bracket closing
- Handled rejected promises are recognized as caught
- Error causes in the Console
- Network panel improvements
- Inspect Early Hints headers
- Hide the Waterfall column
- Performance panel improvements
- Capture CSS selector statistics
- Change order and hide tracks
- Ignore retainers in the Memory panel
- Lighthouse 11.7.1
- Miscellaneous highlights
- New Autofill panel
- Enhanced network throttling for WebRTC
- Scroll-driven animations support in the Animations panel
- Improved CSS nesting support in Elements > Styles