
Performance panel improvements
This version brings several improvements to the Performance panel.
Move and hide tracks with updated track configuration mode
You can now enter the track configuration mode by right-clicking the track name and selecting Configure tracks. The edit button that required extra space has been removed.

The track configuration mode lets you change the order of tracks and hide them. Click up or down to move the track around or click hide. To exit the configuration mode click Finish configuring tracks at the bottom. This configuration persists for new traces but not for next DevTools sessions.
Chromium issue: 336266699.
Ignore scripts in the flame chart
The flame chart in the Main track adds ignore list support. You can now right-click a script in the chart and select Add script to ignore list.
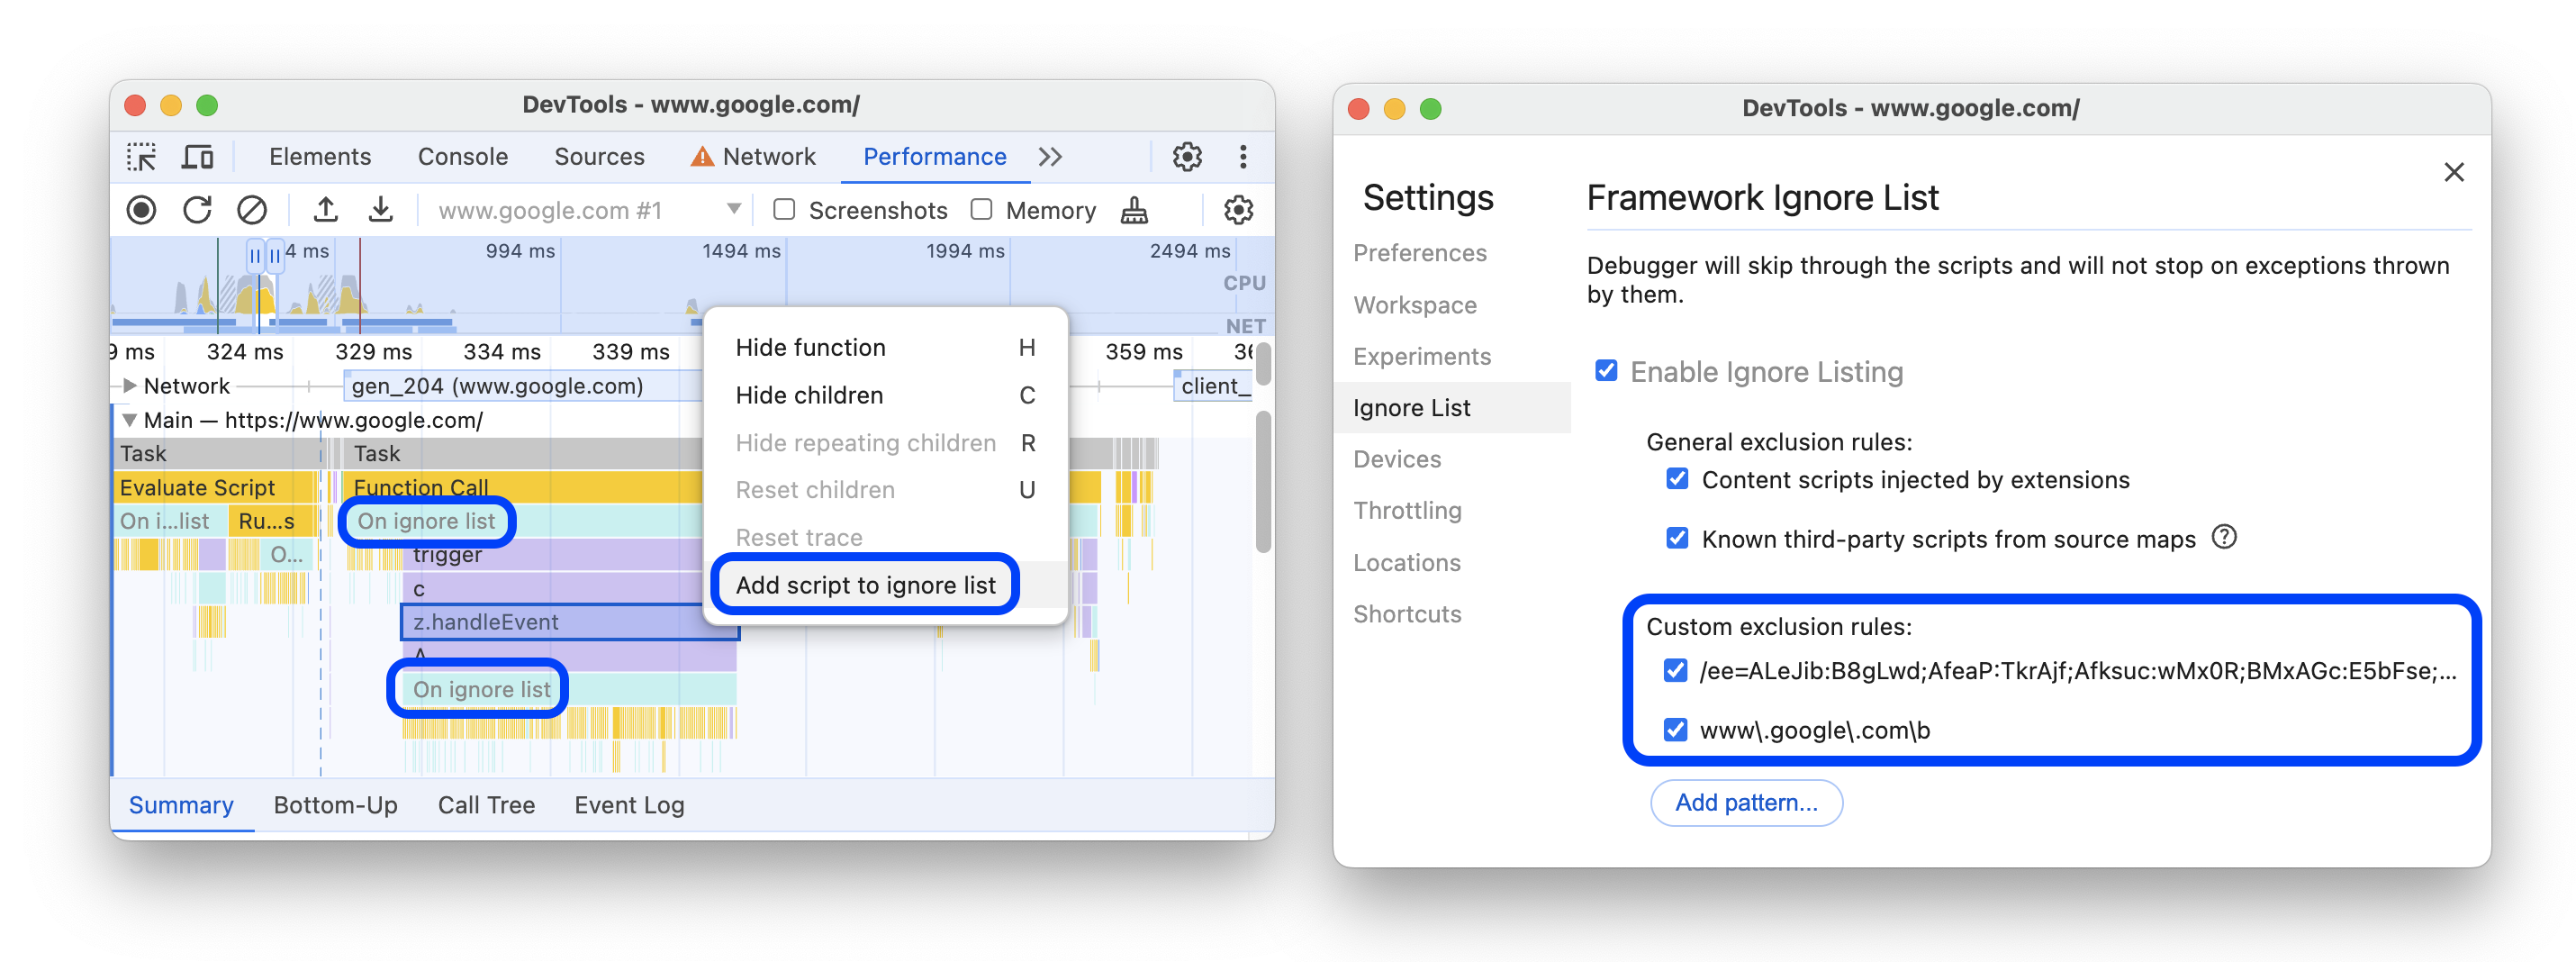
The chart collapses ignored scripts, marks them as On ignore list, and adds them to the Custom exclusion rules in Settings > Ignore list. Ignored scripts are saved until you remove them either from the trace or from the Custom exclusion rules.
Chromium issue: 336266714.
Throttle down the CPU by 20 times
The CPU throttling menu in Capture settings of the Performance panel gets a new 20x slowdown option. So, you can now more accurately reproduce and analyze real-world performance issues, even on high-end computers.

Chromium issue: 324978881.
Performance insights panel will be deprecated
The experimental Performance insights panel will be deprecated in 2024. The DevTools team is working on integrating its most useful features to the Performance panel. The Performance insights panel now shows a banner at the top informing you about the upcoming deprecation.

To learn more, see Performance tooling in 2024 and beyond.
If you have any feedback on what's working, what's not, and what you think can be done better, we want to hear from you.
Paste entire header strings to override them
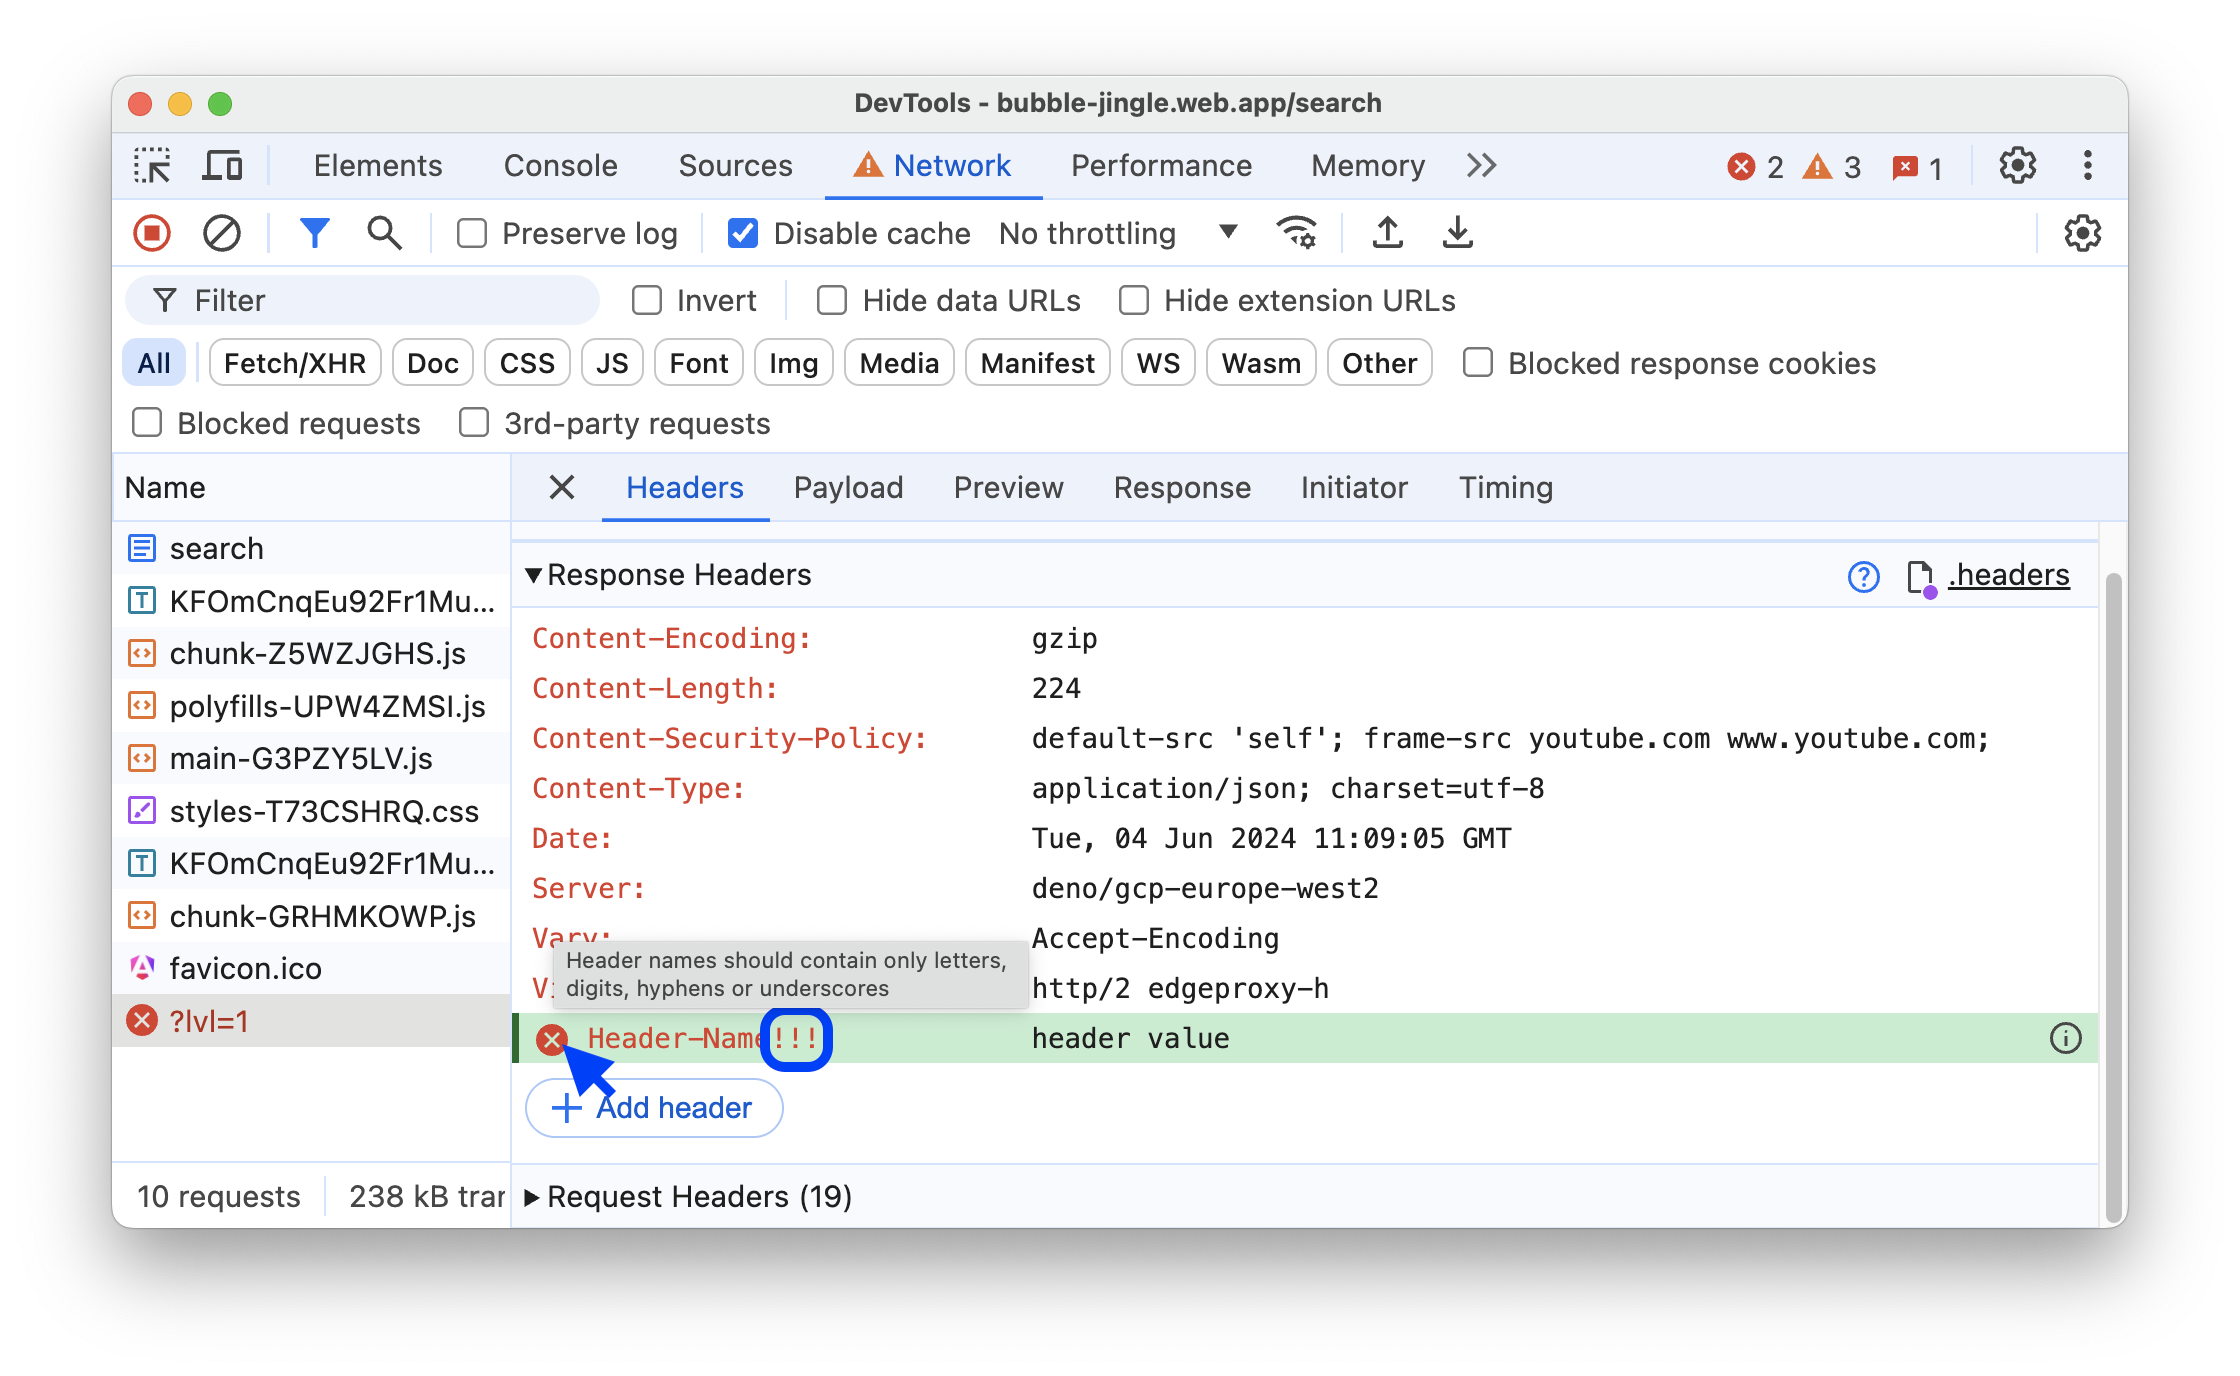
When overriding headers, you can now paste an entire header string (HEADER_NAME: VALUE) and DevTools will split the string at : into a header name and its value.
See this in action in the following video.
When editing headers, the Network panel now warns you if you entered any characters other than alphanumerics, hyphens, and underscores.
Additionally, override menu options and Edit buttons are disabled for chrome://-URLs, which matches intended behavior.
Chromium issues: 330967147, 337012362, 328210785.
Find excessive memory usage with new filters in heap snapshots
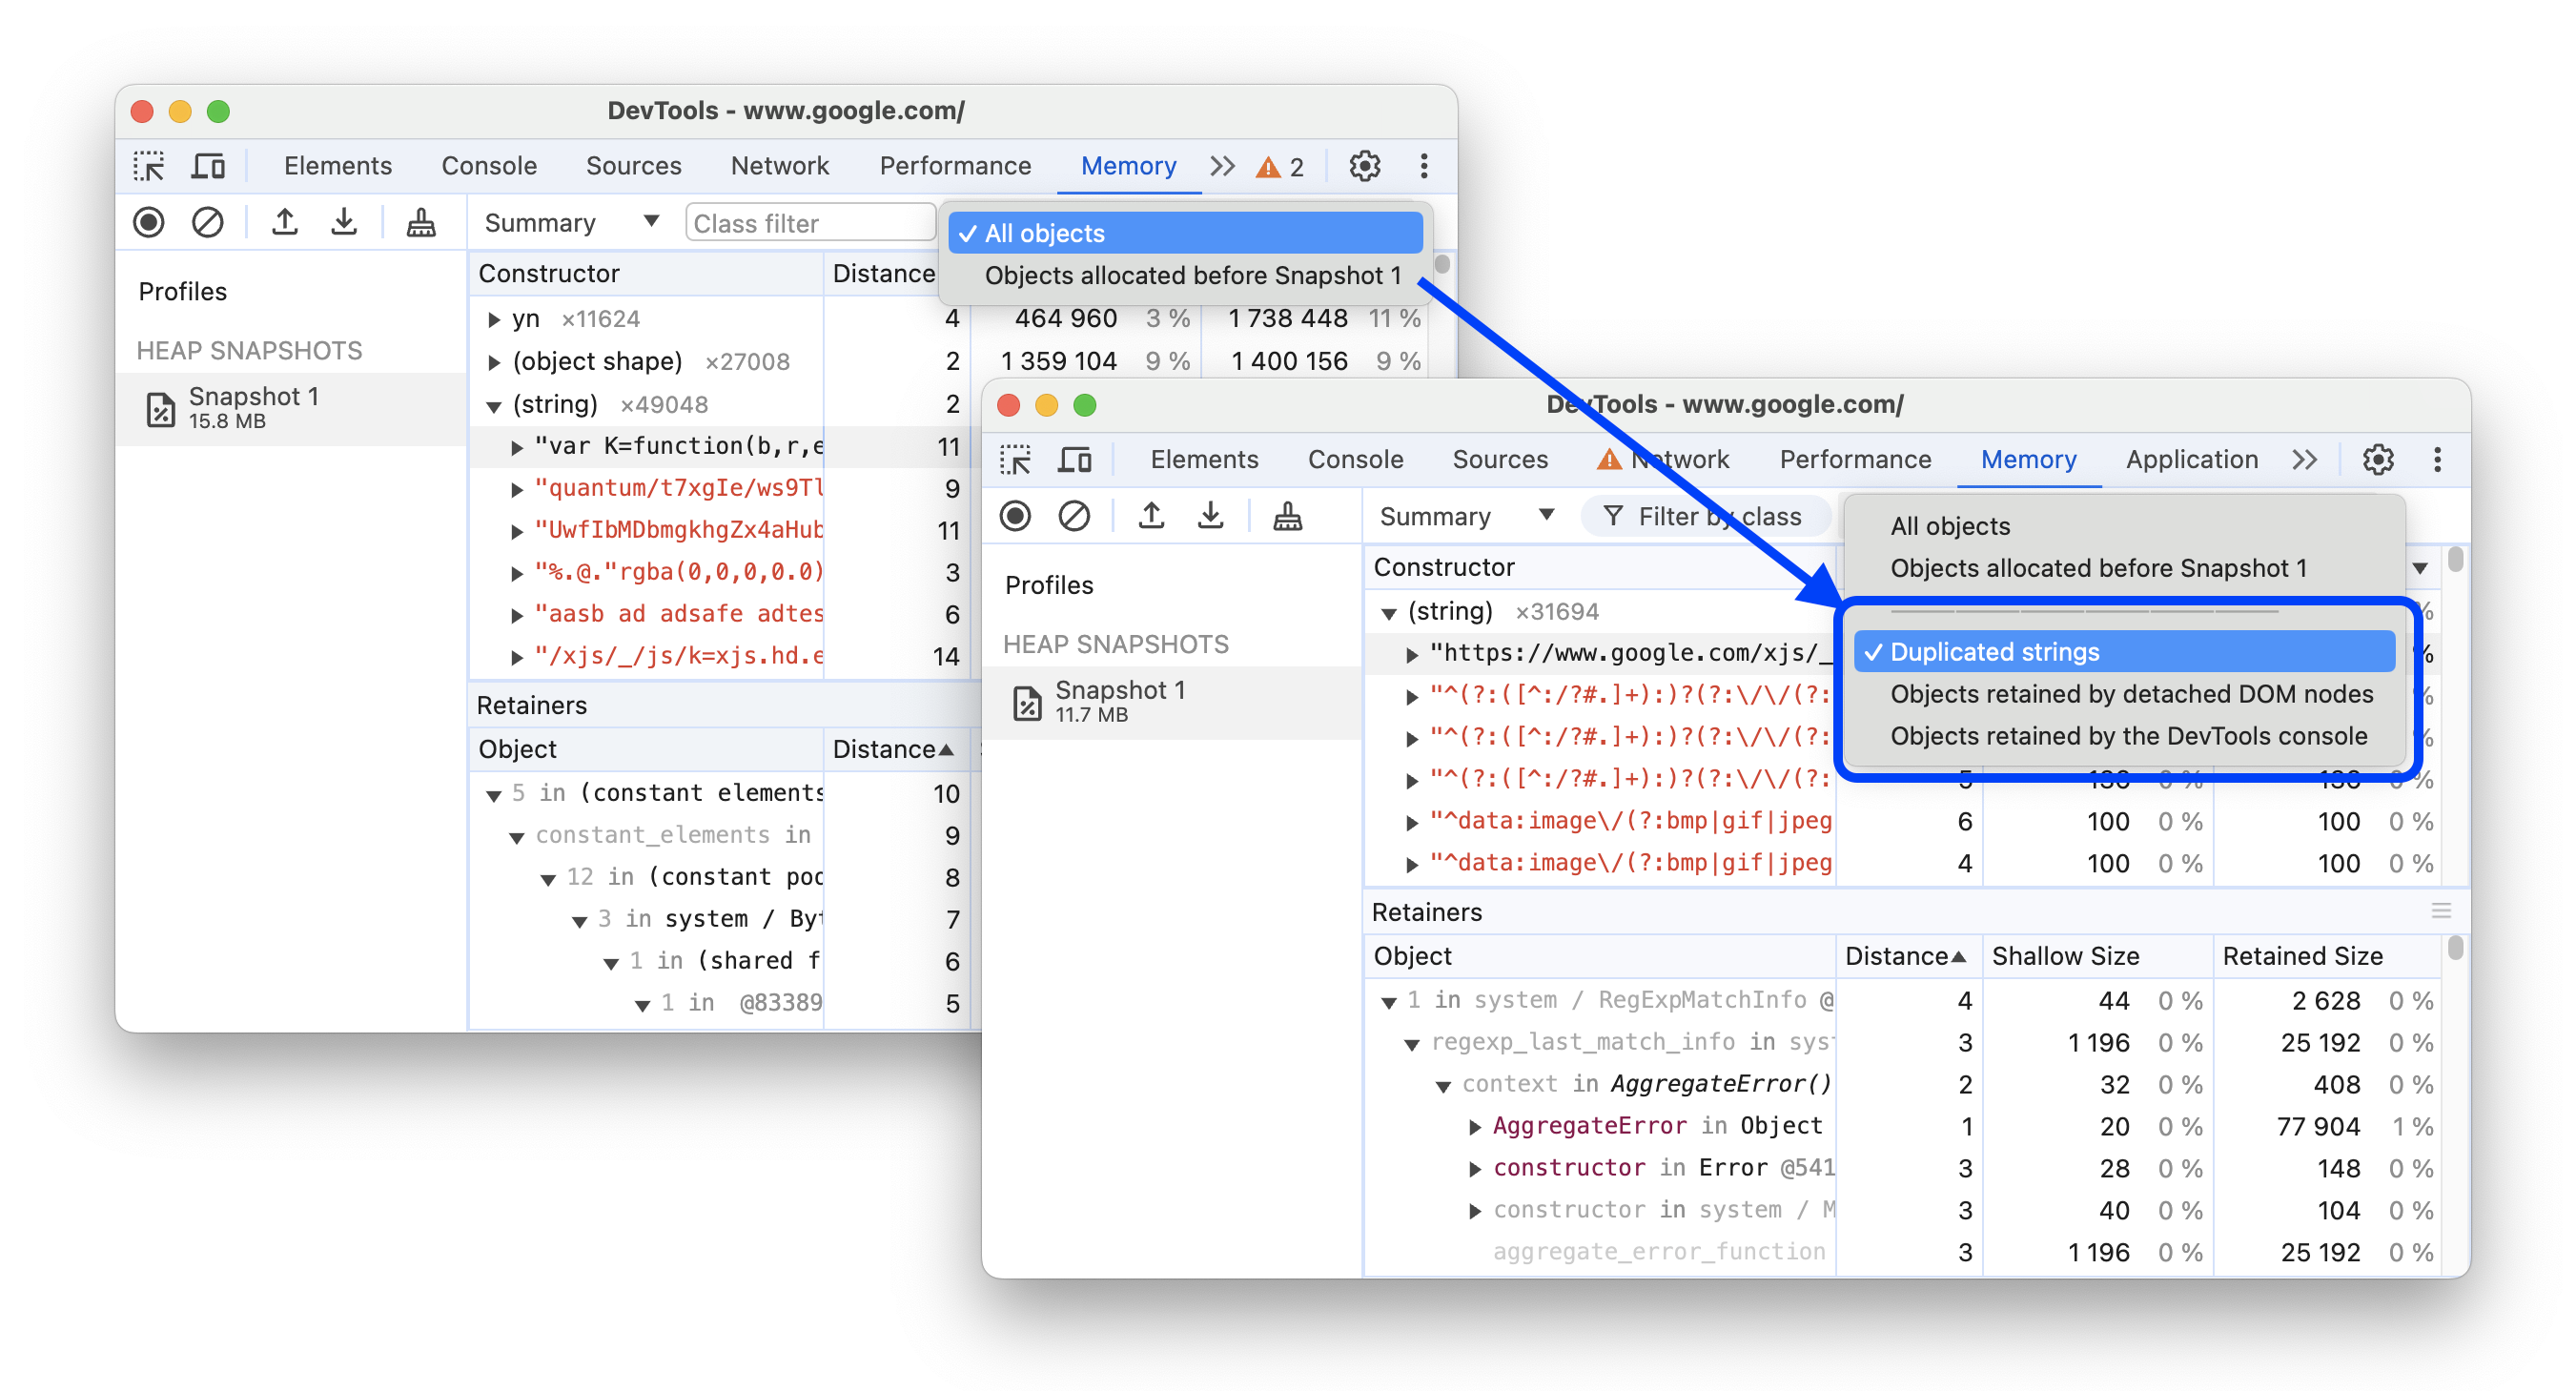
Heap snapshots in the Memory panel get new filters that can help you find common cases of inefficient memory usage, such as duplicated strings, objects retained by detached DOM nodes and the DevTools Console.
Chromium issue: 337094903.
Inspect storage buckets in Application > Storage
You can now inspect storage buckets in a dedicated tree in the Application > Storage section. This tree, previously experimental, has been enabled by default.

Chromium issue: 338094915.
Disable self-XSS warnings with a command-line flag
If you automate Chrome usage or otherwise open DevTools from the command line for debugging, you'll often want to disable the self-XSS warning that appears in every new DevTools session.

You can now disable this dialog by passing the --unsafely-disable-devtools-self-xss-warnings command-line flag to Chrome.
Chromium issue: 41491762.
Lighthouse 12.0.0
The Lighthouse panel now runs Lighthouse 12.0.0.
This update brings a number of changes, including PWA category removal, SEO category reorganization, Overall Savings deprecation, new audits and audit changes. See the full list of changes.
To learn the basics of using the Lighthouse panel in DevTools, see Lighthouse: Optimize website speed.
Chromium issue: 772558.
Miscellaneous highlights
These are some noteworthy fixes and improvements in this release:
- Performance:
- The slow capture settings (Enable advanced paint instrumentation and Enable CSS selector stats) now automatically clear in the next DevTools session.
- The Selector Stats tab now doesn't automatically scroll to the bottom as you zoom the flame chart and data changes (337999939).
- Console: The Ctrl+` shortcut now closes the Console in the drawer only if it's in focus (40875466, 328210785).
- Autofill: Address parsing is fixed (335409093, 335409707).
- Accessibility: Screen reader announcements for localized strings are fixed (324930007).
Download the preview channels
Consider using the Chrome Canary, Dev, or Beta as your default development browser. These preview channels give you access to the latest DevTools features, let you test cutting-edge web platform APIs, and help you find issues on your site before your users do!
Get in touch with the Chrome DevTools team
Use the following options to discuss the new features, updates, or anything else related to DevTools.
- Submit feedback and feature requests to us at crbug.com.
- Report a DevTools issue using the More options > Help > Report a DevTools issue in DevTools.
- Tweet at @ChromeDevTools.
- Leave comments on What's new in DevTools YouTube videos or DevTools Tips YouTube videos.
What's new in DevTools
A list of everything that has been covered in the What's new in DevTools series.
- DevTools MCP server updates
- Improved trace sharing
- Support for @starting-style
- Editor widget for display: masonry
- Lighthouse 13
- Code suggestions from Gemini
- Enhancements for the DevTools MCP server
- Quicker access to AI assistance
- Debug the full performance trace with Gemini
- Toggle drawer orientation
- Google Developer Program
- Miscellaneous highlights
- Chrome DevTools (MCP) for your AI agent
- Debug the network dependency tree with Gemini
- Export your chats with Gemini
- Persisted track configuration in the Performance panel
- Filter IP protected network requests
- Elements > Layout tab adds masonry layout support
- Lighthouse 12.8.2
- Miscellaneous highlights
- Debug more insights with Gemini
- Emulate the 'Save-Data' header in 'Network conditions'
- See the Baseline status in a CSS property tooltip
- Override form factors in user agent client hints
- Lighthouse 12.8.0
- Miscellaneous highlights
- A more reliable and productive Chrome DevTools
- Upload images in AI assistance for styling
- Add request headers to the table in Network
- Check out the highlights from Google I/O 2025
- Miscellaneous highlights
- Performance panel improvements
- Preconnected origins in 'Network dependency tree' insight
- Server response and redirection times in 'Document request latency' insight
- Redirects in Summary of network requests
- Reduced noise in the performance trace
- Deprecated 'Disable JavaScript samples'
- Geolocation accuracy parameter in Sensors
- Elements panel improvements
- Debug complex CSS values easier
- @function support in Elements > Styles
- Network panel improvements
- has-request-header filter
- Direct Sockets in Isolated Web Apps
- Miscellaneous highlights
- Accessibility
- Google I/O 2025 edition
- Modify and save CSS changes to your workspace with Gemini
- Connect a workspace folder and save changes back to your source files
- Ask Gemini about performance insights
- Annotate performance findings with Gemini
- Add screenshots to your chats with Gemini
- New insights in the Performance panel
- Duplicated JavaScript
- Legacy JavaScript
- Speculations now support rule tags
- Lighthouse 12.6.0
- Miscellaneous highlights
- Accessibility
- Performance panel improvements
- New performance insights
- Click to highlight
- Server timings in Summary of network requests
- Filter cookies in 'Privacy and security'
- Sizes in kB units in tables across panels
- Autocomplete supports corner-shape and corner-*-shape in Elements > Styles
- Experimental: Highlighting issues with elements and attributes in DOM
- Lighthouse 12.5.0
- Miscellaneous highlights
- Performance panel improvements
- Origin and script links for profile and function calls in Performance
- LCP by phase field data support
- Network dependency tree insight
- Duration instead of total and self time in Summary
- Heaviest stack highlighting
- Improved empty states for various panels
- Accessibility tree view in Elements
- Lighthouse 12.4.0
- Miscellaneous highlights
- Privacy and security panel
- Performance panel improvements
- Calibrated CPU throttling presets
- Select different performance events in the same AI chat
- First- and third-party highlighting in Performance
- Field data in marker tooltips and insights
- Forced reflow insight
- 'Optimize DOM size' insight
- Extend the performance trace with console.timeStamp
- Elements panel improvements
- Real-time values of animated styles
- Support for :open pseudo-class and various pseudo-elements
- Copy all console messages
- Byte units in the Memory panel
- Miscellaneous highlights
- Persistent AI chat history
- Performance panel improvements
- Image delivery insight
- Classic and modern keyboard navigation
- Ignore irrelevant scripts in the flame chart
- Timeline marker and range highlighting on hover
- Recommended throttling settings
- Timings markers in an overlay
- Stack traces of JS calls in Summary
- Badge settings moved to menu in Elements
- New 'What's new' panel
- Lighthouse 12.3.0
- Miscellaneous highlights
- Debug network requests, source files, and performance traces with Gemini
- View AI chat history
- Manage extension storage in Application > Storage
- Performance improvements
- Interaction phases in live metrics
- Render blocking information in the Summary tab
- Support for scheduler.postTask events and their initiator arrows
- Animations panel and Elements > Styles tab improvements
- Jump from Elements > Styles to Animations
- Real-time updates in Computed tab
- Compute pressure emulation in Sensors
- JS objects with the same name grouped by source in the Memory panel
- A new look for settings
- Performance insights panel is deprecated and removed from DevTools
- Miscellaneous highlights
- Debug CSS with Gemini
- Control AI features in a dedicated settings tab
- Performance panel improvements
- Annotate and share performance findings
- Get performance insights right in the Performance panel
- Spot excessive layout shifts easier
- Spot the non-composited animations
- Hardware concurrency moves to Sensors
- Ignore anonymous scripts and focus on your code in stack traces
- Elements > Styles: Support for sideways-* writing modes for grid overlays and CSS-wide keywords
- Lighthouse audits for non-HTTP pages in timespan and snapshot modes
- Accessibility improvements
- Miscellaneous highlights
- Network panel improvements
- Network filters reimagined
- HAR exports now exclude sensitive data by default
- Elements panel improvements
- Autocomplete values for text-emphasis-* properties
- Scroll overflows marked with a badge
- Performance panel improvements
- Recommendations in live metrics
- Navigate breadcrumbs
- Memory panel improvements
- New 'Detached elements' profile
- Improved naming of plain JS objects
- Turn off dynamic theming
- Chrome Experiment: Process sharing
- Lighthouse 12.2.1
- Miscellaneous highlights
- Recorder supports export to Puppeteer for Firefox
- Performance panel improvements
- Live metrics observations
- Search requests in the Network track
- See stack traces of performance.mark and performance.measure calls
- Use test address data in the Autofill panel
- Elements panel improvements
- Force more states for specific elements
- Elements > Styles now autocompletes more grid properties
- Lighthouse 12.2.0
- Miscellaneous highlights
- Console insights by Gemini are going live in most European countries
- Performance panel updates
- Enhanced Network track
- Customize performance data with extensibility API
- Details in the Timings track
- Copy all listed requests in the Network panel
- Faster heap snapshots with named HTML tags and less clutter
- Open Animations panel to capture animations and edit @keyframes live
- Lighthouse 12.1.0
- Accessibility improvements
- Miscellaneous highlights
- Inspect CSS anchor positioning in the Elements panel
- Sources panel improvements
- Enhanced 'Never Pause Here'
- New scroll snap event listeners
- Network panel improvements
- Updated network throttling presets
- Service worker information in custom fields of the HAR format
- Send and receive WebSocket events in the Performance panel
- Miscellaneous highlights
- Performance panel improvements
- Move and hide tracks with updated track configuration mode
- Ignore scripts in the flame chart
- Throttle down the CPU by 20 times
- Performance insights panel will be deprecated
- Find excessive memory usage with new filters in heap snapshots
- Inspect storage buckets in Application > Storage
- Disable self-XSS warnings with a command-line flag
- Lighthouse 12.0.0
- Miscellaneous highlights
- Understand errors and warnings in the Console better with Gemini
- @position-try rules support in Elements > Styles
- Sources panel improvements
- Configure automatic pretty-printing and bracket closing
- Handled rejected promises are recognized as caught
- Error causes in the Console
- Network panel improvements
- Inspect Early Hints headers
- Hide the Waterfall column
- Performance panel improvements
- Capture CSS selector statistics
- Change order and hide tracks
- Ignore retainers in the Memory panel