
Understand errors and warnings in the Console better with Gemini
This Chrome version brings generative AI capabilities to the DevTools Console, aimed to give you a better understanding of the errors and warnings you encounter.
To get an AI-generated explanation of an error or warning, click the Understand this error (warning) button next to the message in the Console and follow instructions.

For more information, see Understand errors and warnings better with AI.
@position-try rules support in Elements > Styles
To help you debug CSS anchor positioning, the Elements > Styles tab now supports @position-try CSS rules. The tab resolves position-try-options values and links each option to a dedicated @position-try --name section.
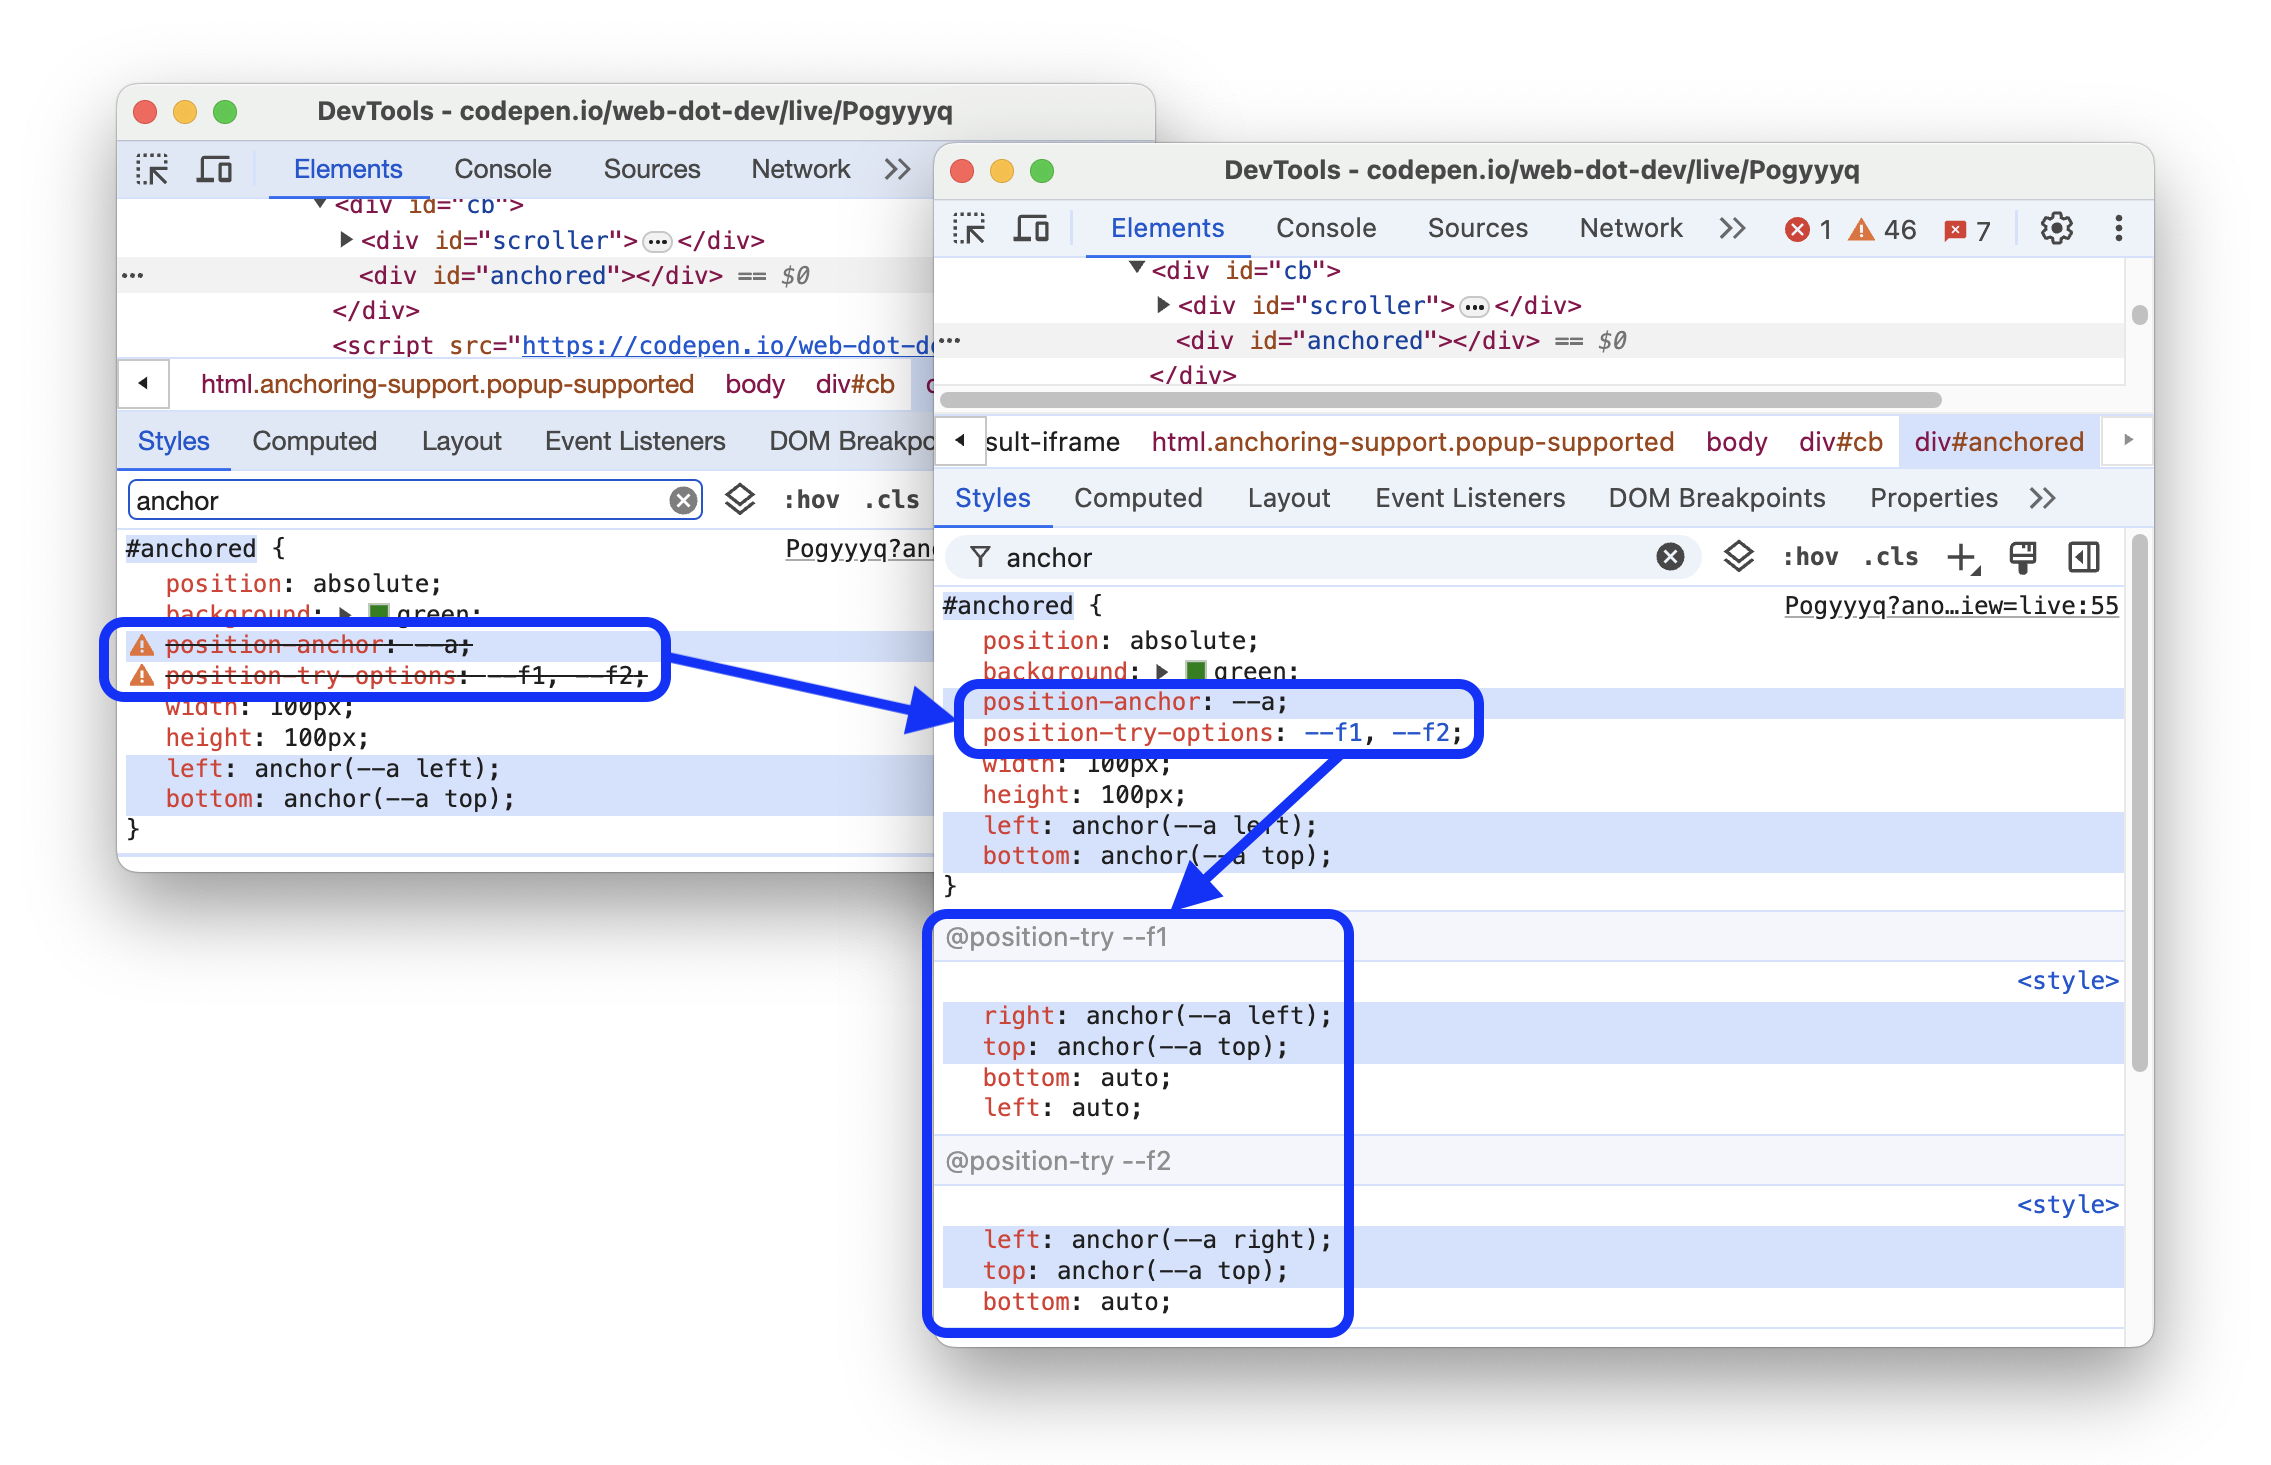
To learn more, see Introducing the CSS anchor positioning API.
Chromium issue: 40279608.
Sources panel improvements
This version brings several improvements to the Sources panel.
Configure automatic pretty-printing and bracket closing
You can now turn on or off the automatic pretty-printing and bracket closing for the Editor in Sources. Pretty-printing makes minified files readable. Bracket closing automatically adds a closing bracket () or }) or tag (>) when you type an opening one.
To configure the relevant behaviour, check or clear the new Auto closing brackets and Automatically pretty print minified sources options in Settings > Preferences > Sources.
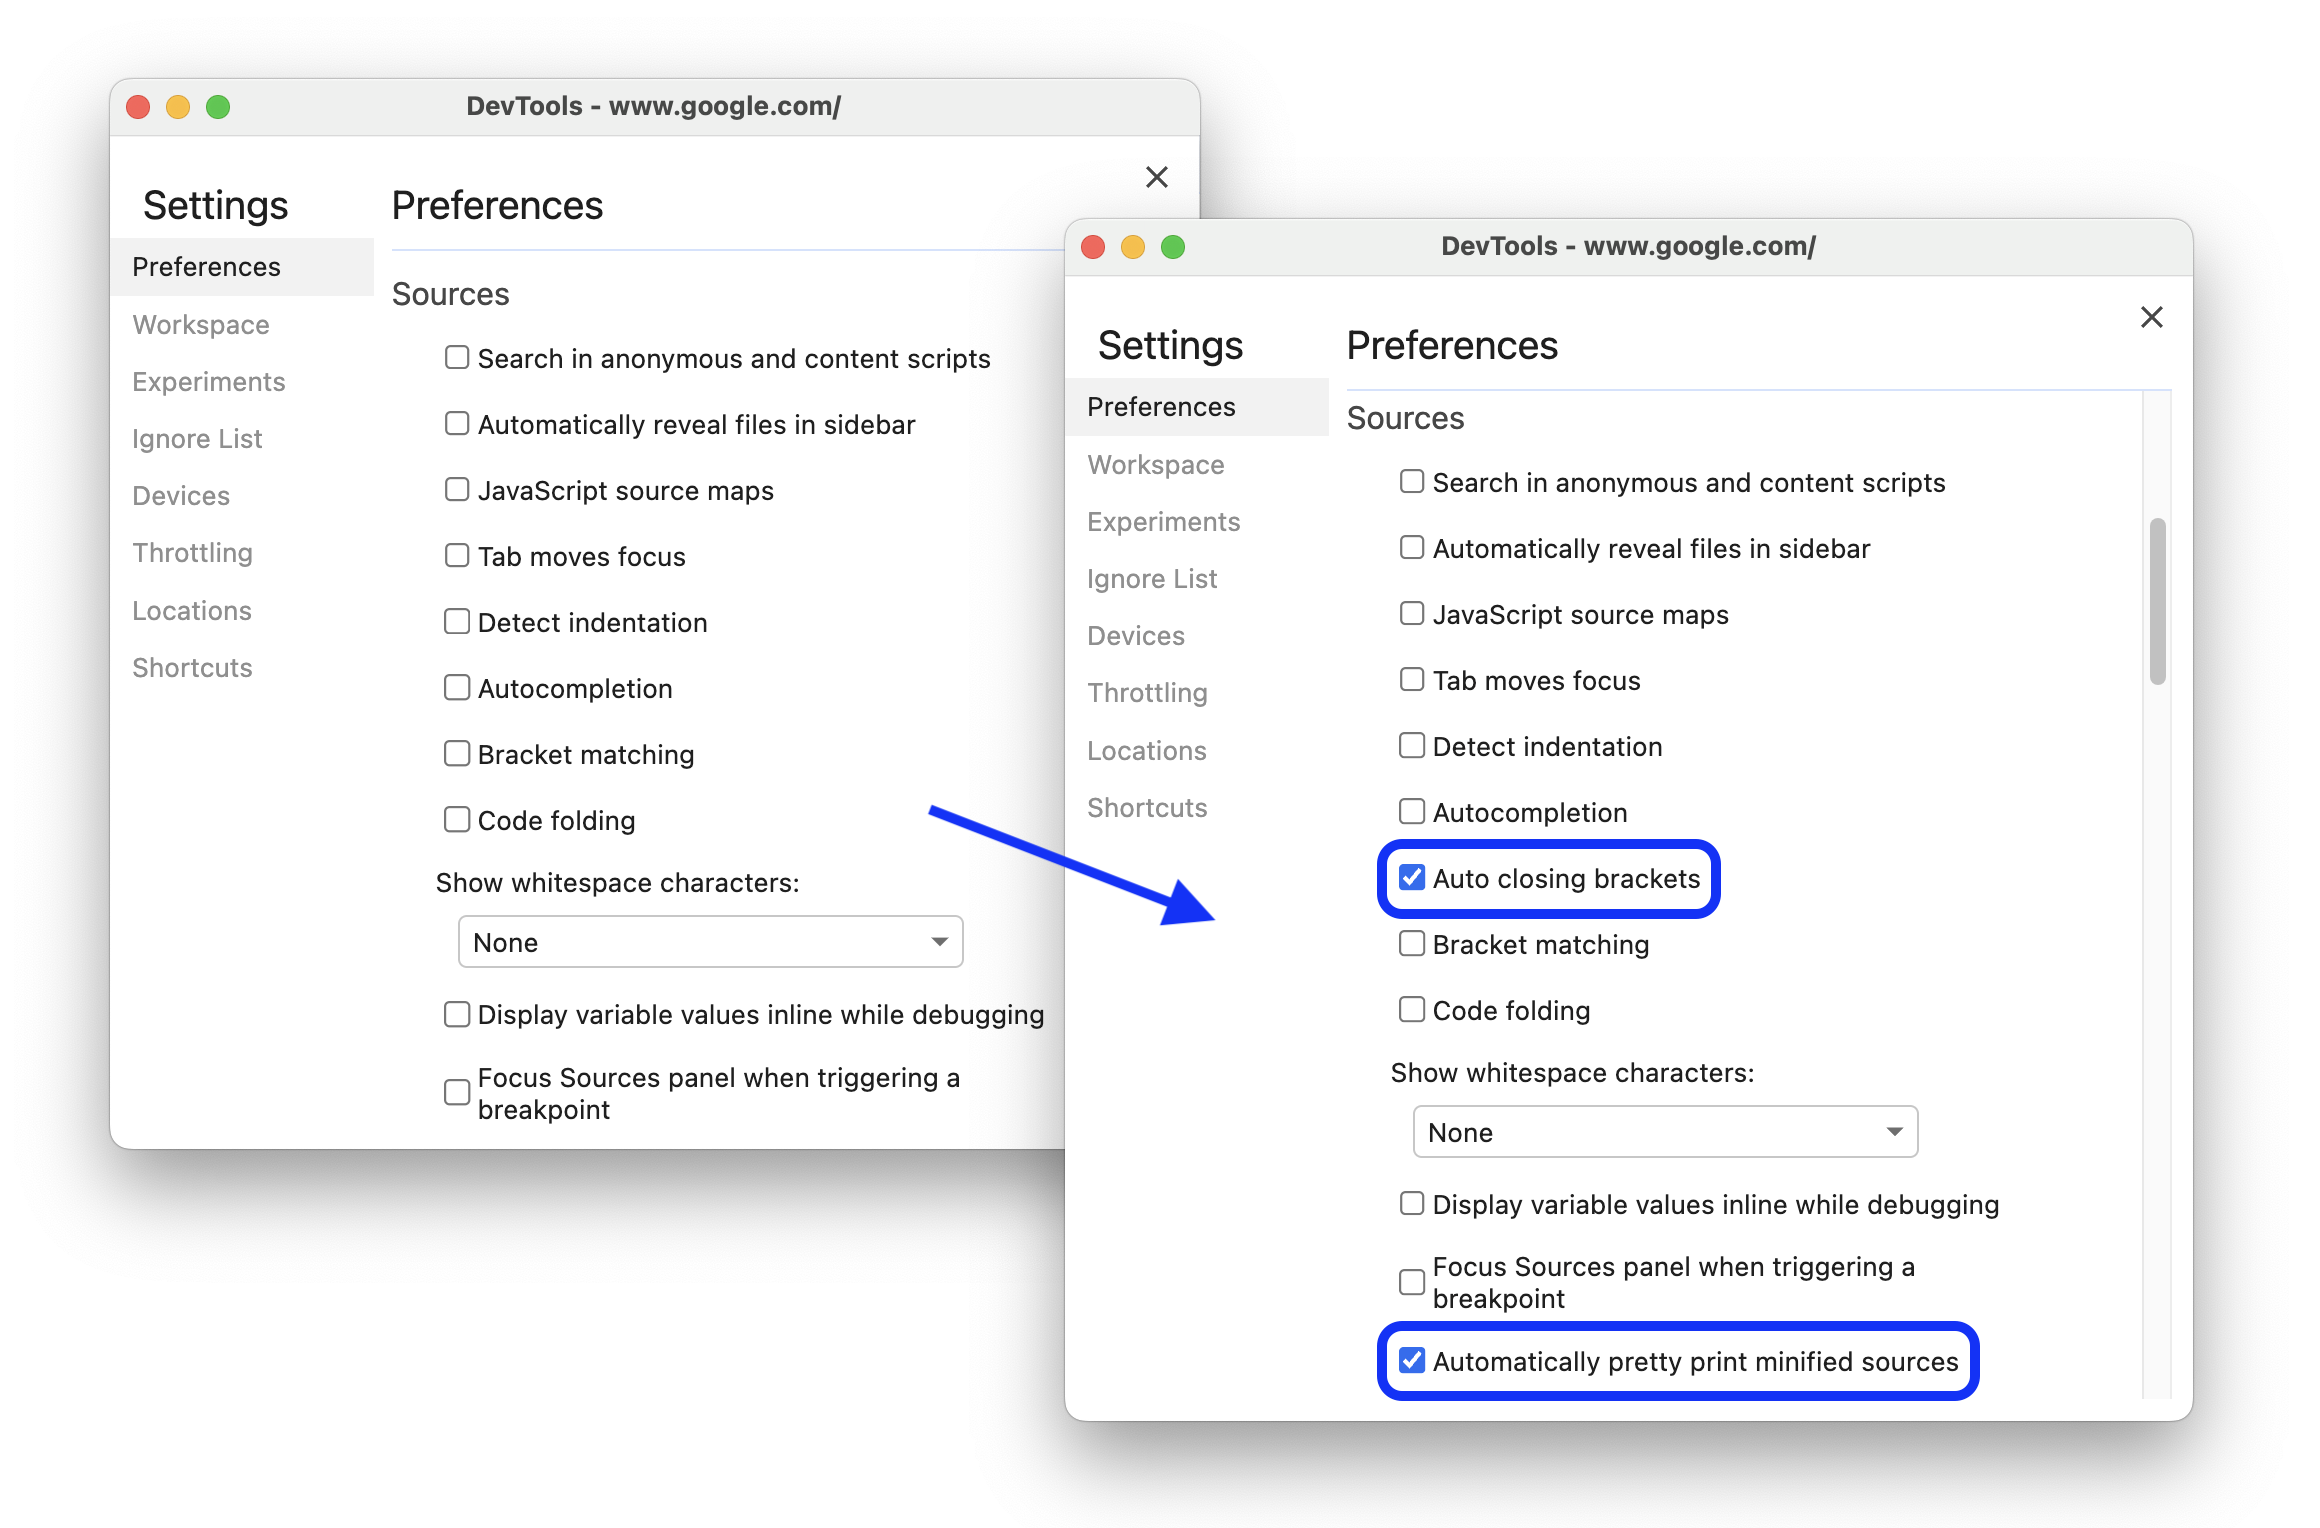
Chromium issues: 40865010, 324314570.
Handled rejected promises are recognized as caught
The Sources panel now correctly recognizes rejected promises as caught if you handled them with .catch() or two-argument .then().
In other words, when Sources > Breakpoints > Pause on uncaught exceptions is turned on, the debugger won't pause on statements similar to the following:
Promise.reject(new Error('fail')).catch((e)=>console.log('caught'));

Chromium issue: 40283993.
Error causes in the Console
The Console now shows you chains of error causes in the stack trace, if any.
To make debugging easier, you can specify error causes when catching and rethrowing errors. As the Console walks up the cause chain, it prints each error stack with a Caused by: prefix, so you can still see the original error.
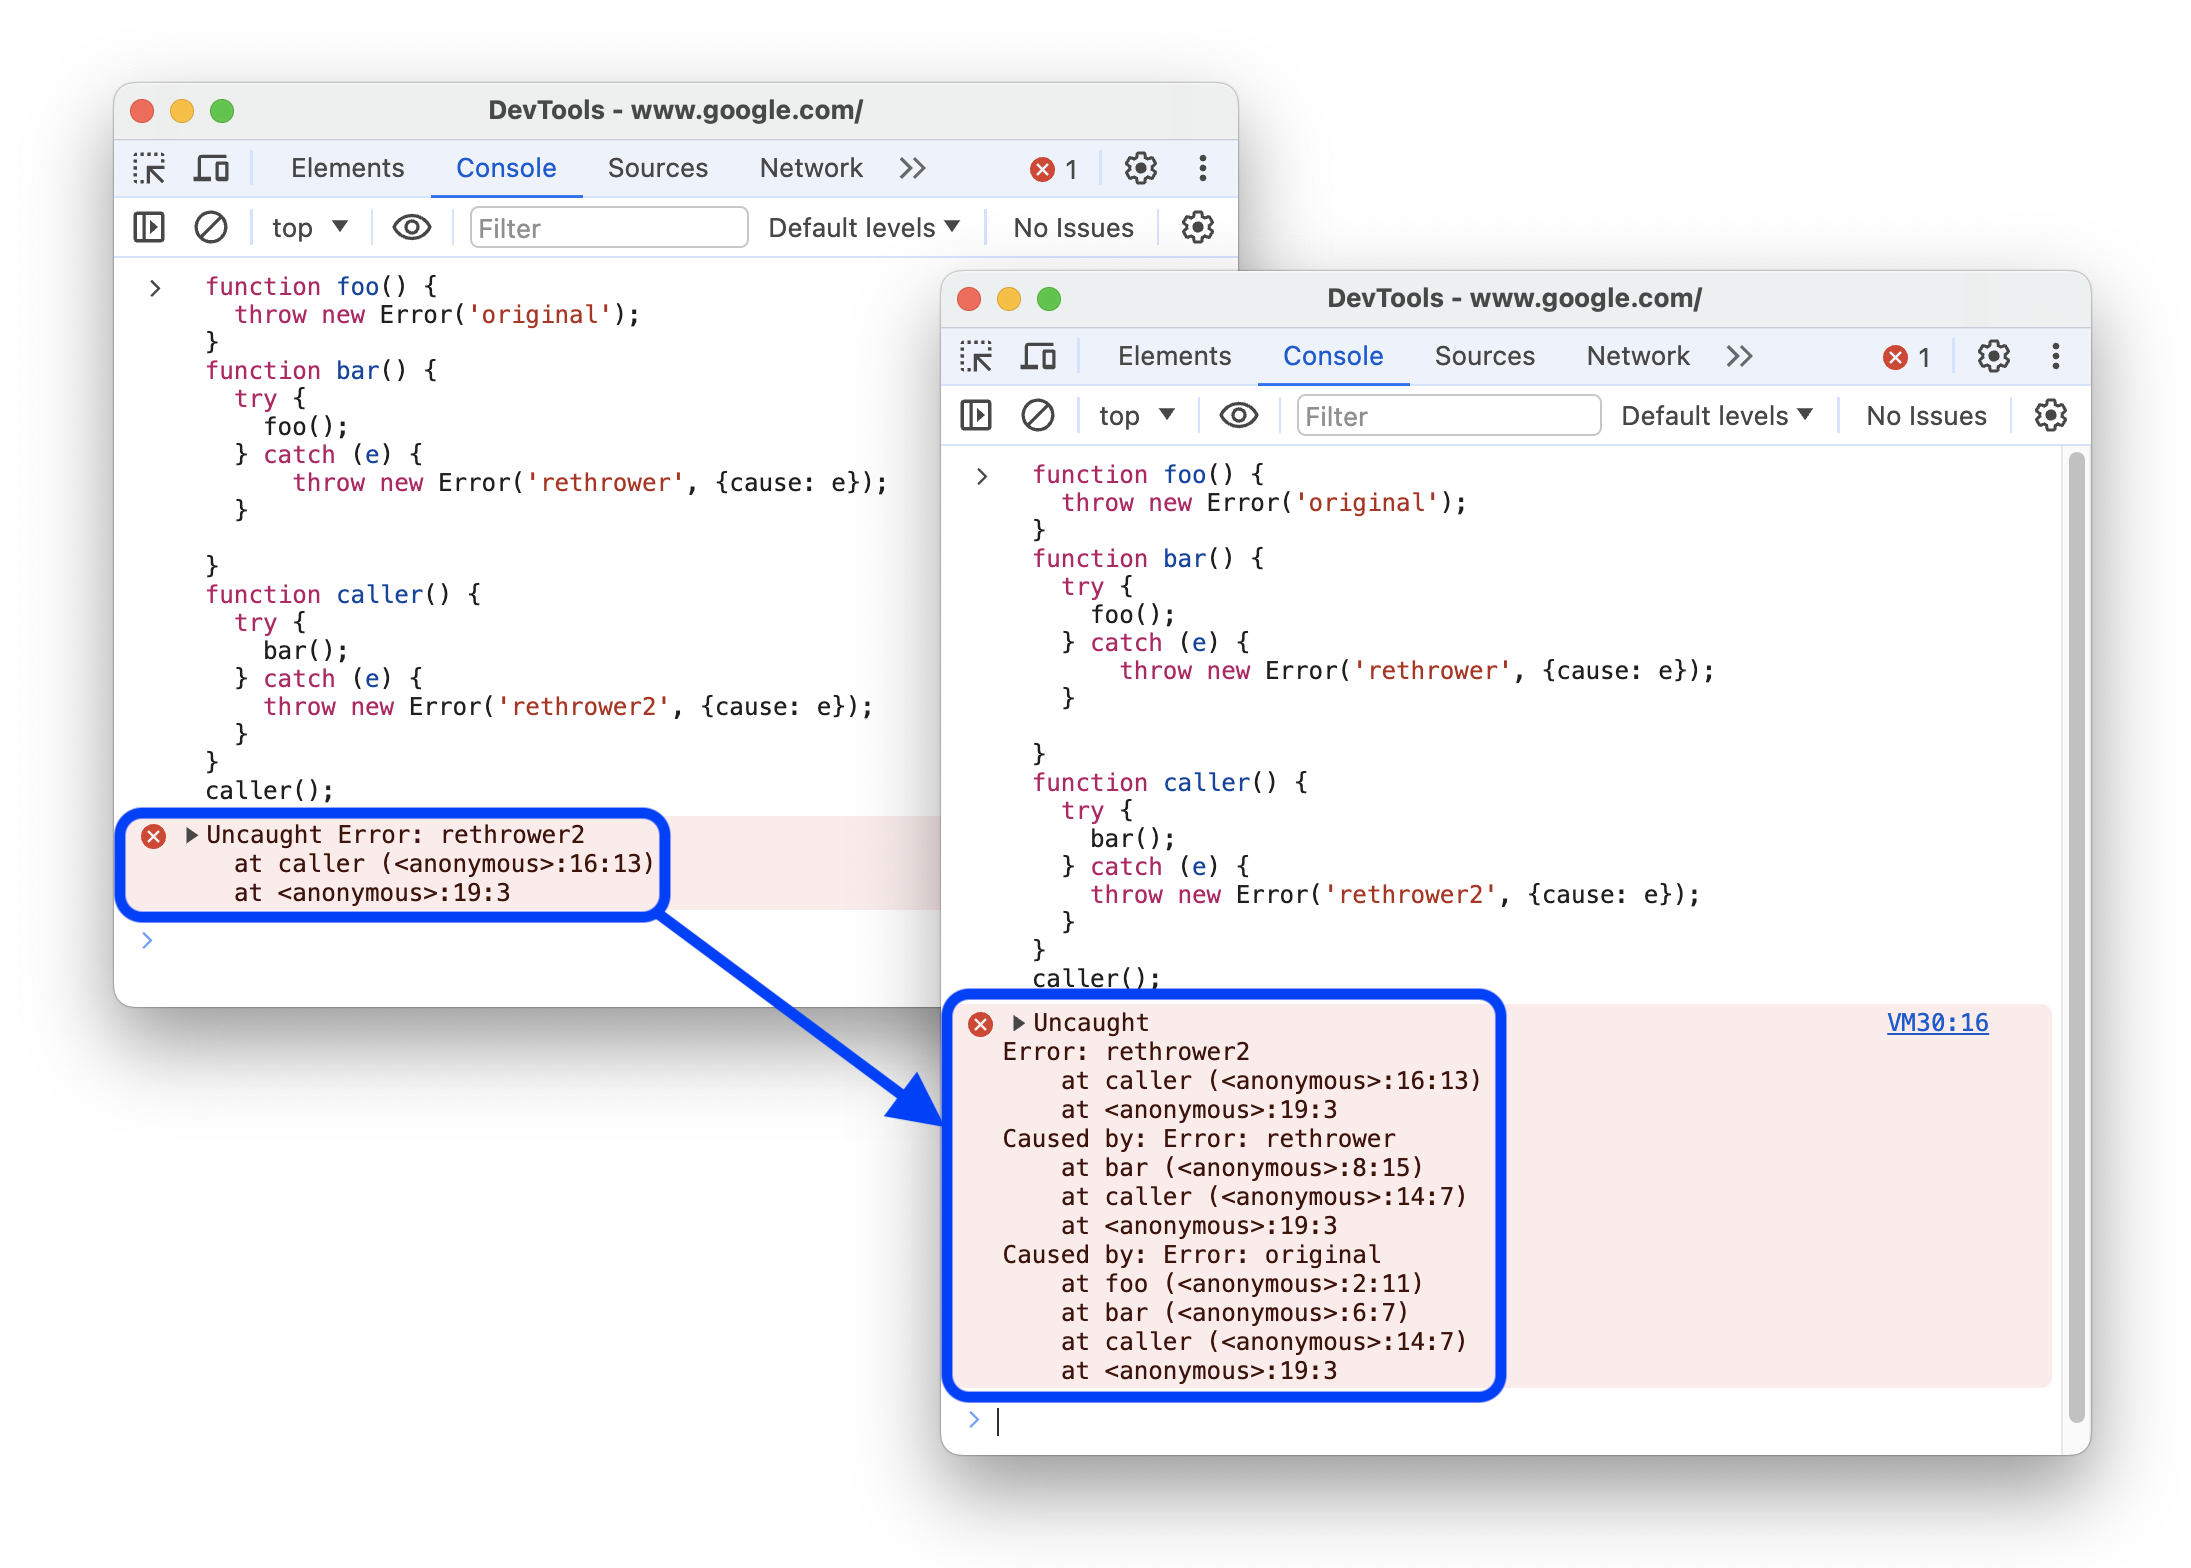
Chromium issue: 40182832.
Network panel improvements
This version brings several improvements to the Network panel.
Inspect Early Hints headers
The Early Hints headers get a dedicated section in the request's Headers tab of the Network panel. Previously, you could find the relevant headers in the Response Headers section.
Early Hints is an HTTP status code (103 Early Hints) used to send a preliminary HTTP response ahead of a final response. This allows a server to send hints to the browser about critical sub-resources (for example, a style sheet or critical JavaScript) or origins that will be likely used by the page, while the server is busy generating the main resource.

For more information, see Faster page loads using server think-time with Early Hints.
Chromium issue: 40222701.
Hide the Waterfall column
You can now hide the Waterfall column in the Network panel similar to how you can hide other columns. Right-click any column name and clear the Waterfall checkbox in the drop-down menu.

Chromium issue: 40574989.
Performance panel improvements
This version brings several improvements to the Performance panel.
Capture CSS selector statistics
The Performance panel gets a new setting to let you capture CSS selector statistics for long-running Recalculate Style events.
To see the statistics, select a Recalculate Style event and open the new Selector Stats tab. The tab shows you information on elapsed time, match attempts and count, and percent of slow-path non-matches for each selector.

Chromium issue: 324282954.
Change order and hide tracks
The Performance panel gets a new configuration mode that lets you change the order of tracks and hide them.
To enter the configuration mode, click the Edit button on the left of the track name. Then click up or down to move the track around or click hide. Click the Check button to the right of the track name when you are done.
The next version, Chrome 126, will bring more improvements to this UI.
Chromium issue: 311439339.
Ignore retainers in the Memory panel
You can now ignore retainers in heap snapshots you capture with the Memory panel.
To ignore a retainer, select an object and, in the Retainer section, right-click a retainer and select Ignore this retainer from the drop-down menu. Ignored retainers are marked withignored value in the Distance column. To stop ignoring, click Restore ignored retainers in the action bar at the top.

Additionally, heap snapshots now support a bigger number (hundreds of millions) of containment edges and nodes (332350576).
Chromium issue: 327337527.
Lighthouse 11.7.1
The Lighthouse panel now runs Lighthouse 11.7.1. See the full list of changes.
Among notable changes is the deprecated support for Publisher Ads plugin, which became outdated in this version.

To learn the basics of using the Lighthouse panel in DevTools, see Lighthouse: Optimize website speed.
Chromium issue: 772558.
Miscellaneous highlights
These are some noteworthy fixes and improvements in this release:
- The Recorder panel is now officially out of preview status (329271496).
- The Console now doesn't show an error when a custom formatter returns a
nullfor thebody()function, which is a valid behavior (329400119). - The Sources panel updated syntax highlighter, in particular, it now supports
vanddflags in regular expression. - The Network > Cookies tab fixed a bug with mapping exempted cookies to response cookies (41491846).
- The Elements > Styles tab now does the following:
Download the preview channels
Consider using the Chrome Canary, Dev, or Beta as your default development browser. These preview channels give you access to the latest DevTools features, let you test cutting-edge web platform APIs, and help you find issues on your site before your users do!
Get in touch with the Chrome DevTools team
Use the following options to discuss the new features, updates, or anything else related to DevTools.
- Submit feedback and feature requests to us at crbug.com.
- Report a DevTools issue using the More options > Help > Report a DevTools issue in DevTools.
- Tweet at @ChromeDevTools.
- Leave comments on What's new in DevTools YouTube videos or DevTools Tips YouTube videos.
What's new in DevTools
A list of everything that has been covered in the What's new in DevTools series.
- DevTools MCP server updates
- Improved trace sharing
- Support for @starting-style
- Editor widget for display: masonry
- Lighthouse 13
- Code suggestions from Gemini
- Enhancements for the DevTools MCP server
- Quicker access to AI assistance
- Debug the full performance trace with Gemini
- Toggle drawer orientation
- Google Developer Program
- Miscellaneous highlights
- Chrome DevTools (MCP) for your AI agent
- Debug the network dependency tree with Gemini
- Export your chats with Gemini
- Persisted track configuration in the Performance panel
- Filter IP protected network requests
- Elements > Layout tab adds masonry layout support
- Lighthouse 12.8.2
- Miscellaneous highlights
- Debug more insights with Gemini
- Emulate the 'Save-Data' header in 'Network conditions'
- See the Baseline status in a CSS property tooltip
- Override form factors in user agent client hints
- Lighthouse 12.8.0
- Miscellaneous highlights
- A more reliable and productive Chrome DevTools
- Upload images in AI assistance for styling
- Add request headers to the table in Network
- Check out the highlights from Google I/O 2025
- Miscellaneous highlights
- Performance panel improvements
- Preconnected origins in 'Network dependency tree' insight
- Server response and redirection times in 'Document request latency' insight
- Redirects in Summary of network requests
- Reduced noise in the performance trace
- Deprecated 'Disable JavaScript samples'
- Geolocation accuracy parameter in Sensors
- Elements panel improvements
- Debug complex CSS values easier
- @function support in Elements > Styles
- Network panel improvements
- has-request-header filter
- Direct Sockets in Isolated Web Apps
- Miscellaneous highlights
- Accessibility
- Google I/O 2025 edition
- Modify and save CSS changes to your workspace with Gemini
- Connect a workspace folder and save changes back to your source files
- Ask Gemini about performance insights
- Annotate performance findings with Gemini
- Add screenshots to your chats with Gemini
- New insights in the Performance panel
- Duplicated JavaScript
- Legacy JavaScript
- Speculations now support rule tags
- Lighthouse 12.6.0
- Miscellaneous highlights
- Accessibility
- Performance panel improvements
- New performance insights
- Click to highlight
- Server timings in Summary of network requests
- Filter cookies in 'Privacy and security'
- Sizes in kB units in tables across panels
- Autocomplete supports corner-shape and corner-*-shape in Elements > Styles
- Experimental: Highlighting issues with elements and attributes in DOM
- Lighthouse 12.5.0
- Miscellaneous highlights
- Performance panel improvements
- Origin and script links for profile and function calls in Performance
- LCP by phase field data support
- Network dependency tree insight
- Duration instead of total and self time in Summary
- Heaviest stack highlighting
- Improved empty states for various panels
- Accessibility tree view in Elements
- Lighthouse 12.4.0
- Miscellaneous highlights
- Privacy and security panel
- Performance panel improvements
- Calibrated CPU throttling presets
- Select different performance events in the same AI chat
- First- and third-party highlighting in Performance
- Field data in marker tooltips and insights
- Forced reflow insight
- 'Optimize DOM size' insight
- Extend the performance trace with console.timeStamp
- Elements panel improvements
- Real-time values of animated styles
- Support for :open pseudo-class and various pseudo-elements
- Copy all console messages
- Byte units in the Memory panel
- Miscellaneous highlights
- Persistent AI chat history
- Performance panel improvements
- Image delivery insight
- Classic and modern keyboard navigation
- Ignore irrelevant scripts in the flame chart
- Timeline marker and range highlighting on hover
- Recommended throttling settings
- Timings markers in an overlay
- Stack traces of JS calls in Summary
- Badge settings moved to menu in Elements
- New 'What's new' panel
- Lighthouse 12.3.0
- Miscellaneous highlights
- Debug network requests, source files, and performance traces with Gemini
- View AI chat history
- Manage extension storage in Application > Storage
- Performance improvements
- Interaction phases in live metrics
- Render blocking information in the Summary tab
- Support for scheduler.postTask events and their initiator arrows
- Animations panel and Elements > Styles tab improvements
- Jump from Elements > Styles to Animations
- Real-time updates in Computed tab
- Compute pressure emulation in Sensors
- JS objects with the same name grouped by source in the Memory panel
- A new look for settings
- Performance insights panel is deprecated and removed from DevTools
- Miscellaneous highlights
- Debug CSS with Gemini
- Control AI features in a dedicated settings tab
- Performance panel improvements
- Annotate and share performance findings
- Get performance insights right in the Performance panel
- Spot excessive layout shifts easier
- Spot the non-composited animations
- Hardware concurrency moves to Sensors
- Ignore anonymous scripts and focus on your code in stack traces
- Elements > Styles: Support for sideways-* writing modes for grid overlays and CSS-wide keywords
- Lighthouse audits for non-HTTP pages in timespan and snapshot modes
- Accessibility improvements
- Miscellaneous highlights
- Network panel improvements
- Network filters reimagined
- HAR exports now exclude sensitive data by default
- Elements panel improvements
- Autocomplete values for text-emphasis-* properties
- Scroll overflows marked with a badge
- Performance panel improvements
- Recommendations in live metrics
- Navigate breadcrumbs
- Memory panel improvements
- New 'Detached elements' profile
- Improved naming of plain JS objects
- Turn off dynamic theming
- Chrome Experiment: Process sharing
- Lighthouse 12.2.1
- Miscellaneous highlights
- Recorder supports export to Puppeteer for Firefox
- Performance panel improvements
- Live metrics observations
- Search requests in the Network track
- See stack traces of performance.mark and performance.measure calls
- Use test address data in the Autofill panel
- Elements panel improvements
- Force more states for specific elements
- Elements > Styles now autocompletes more grid properties
- Lighthouse 12.2.0
- Miscellaneous highlights
- Console insights by Gemini are going live in most European countries
- Performance panel updates
- Enhanced Network track
- Customize performance data with extensibility API
- Details in the Timings track
- Copy all listed requests in the Network panel
- Faster heap snapshots with named HTML tags and less clutter
- Open Animations panel to capture animations and edit @keyframes live
- Lighthouse 12.1.0
- Accessibility improvements
- Miscellaneous highlights
- Inspect CSS anchor positioning in the Elements panel
- Sources panel improvements
- Enhanced 'Never Pause Here'
- New scroll snap event listeners
- Network panel improvements
- Updated network throttling presets
- Service worker information in custom fields of the HAR format
- Send and receive WebSocket events in the Performance panel
- Miscellaneous highlights
- Performance panel improvements
- Move and hide tracks with updated track configuration mode
- Ignore scripts in the flame chart
- Throttle down the CPU by 20 times
- Performance insights panel will be deprecated
- Find excessive memory usage with new filters in heap snapshots
- Inspect storage buckets in Application > Storage
- Disable self-XSS warnings with a command-line flag
- Lighthouse 12.0.0
- Miscellaneous highlights
- Understand errors and warnings in the Console better with Gemini