
Network panel improvements
Override web content locally even faster
The local overrides feature is now streamlined, so you can easily mock response headers and web content of remote resources from the Network panel without access to them.
To override web content, open the Network panel, right-click a request, and select Override content.
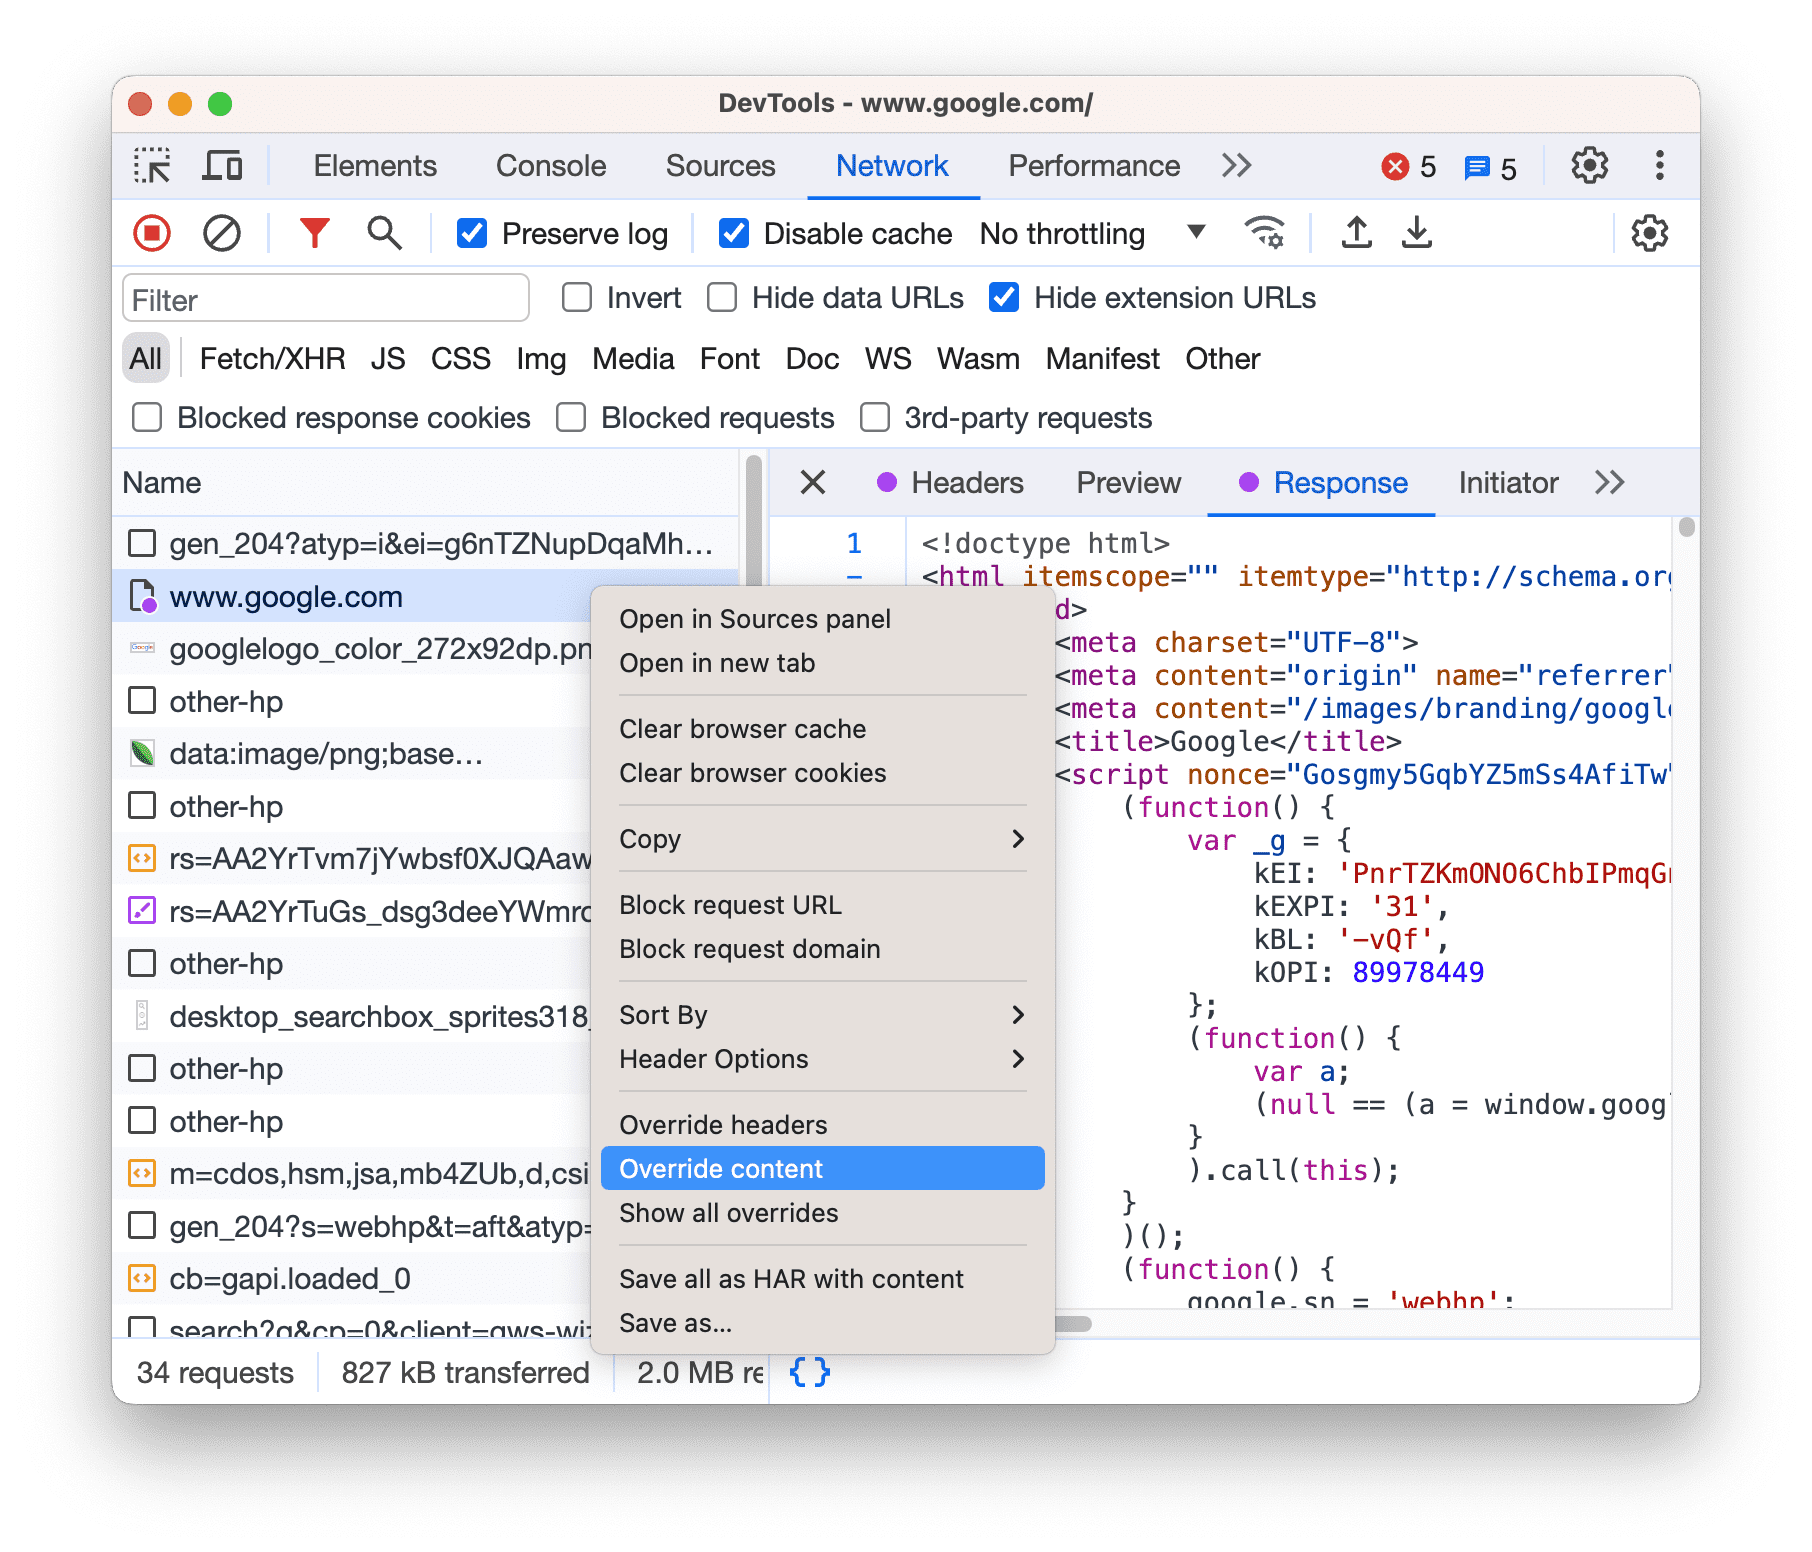
If you have local overrides set up but disabled, DevTools enables them. If you haven't set them up yet, DevTools prompts you in the action bar at the top. Select a folder to store the overrides in and allow DevTools access to it.

Once the overrides are set up, DevTools then takes you to Sources > Overrides > Editor to let you override web content.
Note that the overridden resources are indicated with in the Network panel. Hover over the icon to see what's overridden.
Chromium issues: 1465785, 1470532, 1469359.
Override the content of XHR and fetch requests
You can now override the content of XHR and fetch requests in addition to their response headers. With such overrides, you can mock the API responses to debug your web page even if your backend and API aren't ready yet.
DevTools currently supports content overrides for the following request types: images (for example, avif, png), fonts, fetch and XHR, scripts (css and js), and documents (html). DevTools now grays out the Override content option for unsupported types.
Chromium issues: 792101, 1469776.
Hide Chrome extension requests
To help you focus on the code you author and filter out irrelevant requests sent by extensions you might have installed in Chrome, the Network panel gets a new filter.
To filter out all the requests sent to chrome-extension:// URLs, check Hide extension URLs.

Chromium issues: 1257885, 1458803.
Human-readable HTTP status codes
The Status Code in the request's header now shows human-readable text next to the HTTP status codes, so you can figure out what happened to the request quicker.
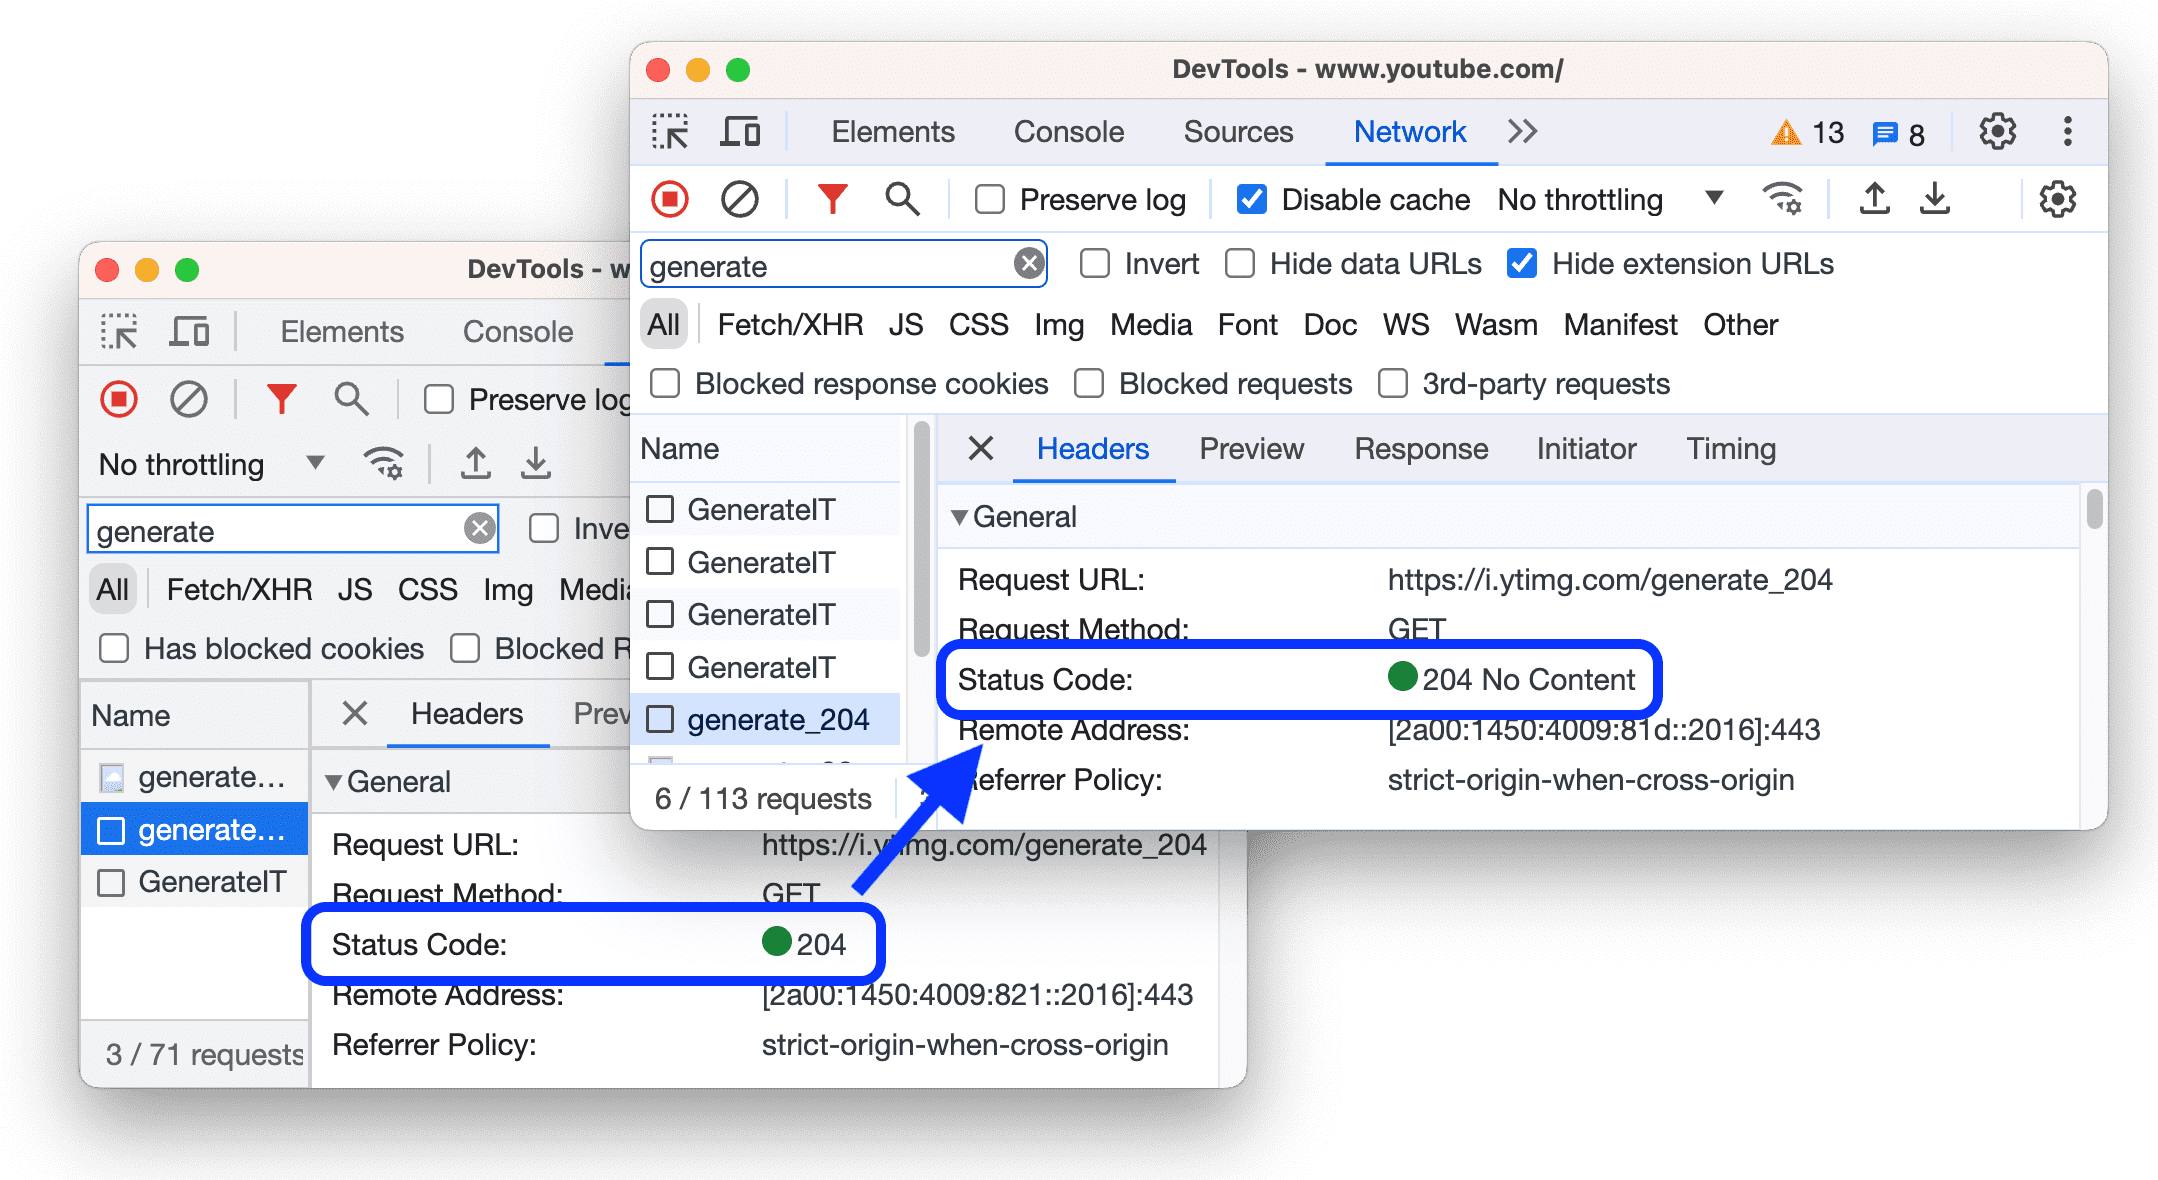
You can also hover over the status code in the request table to see the same text.
Chromium issue: 1153956.
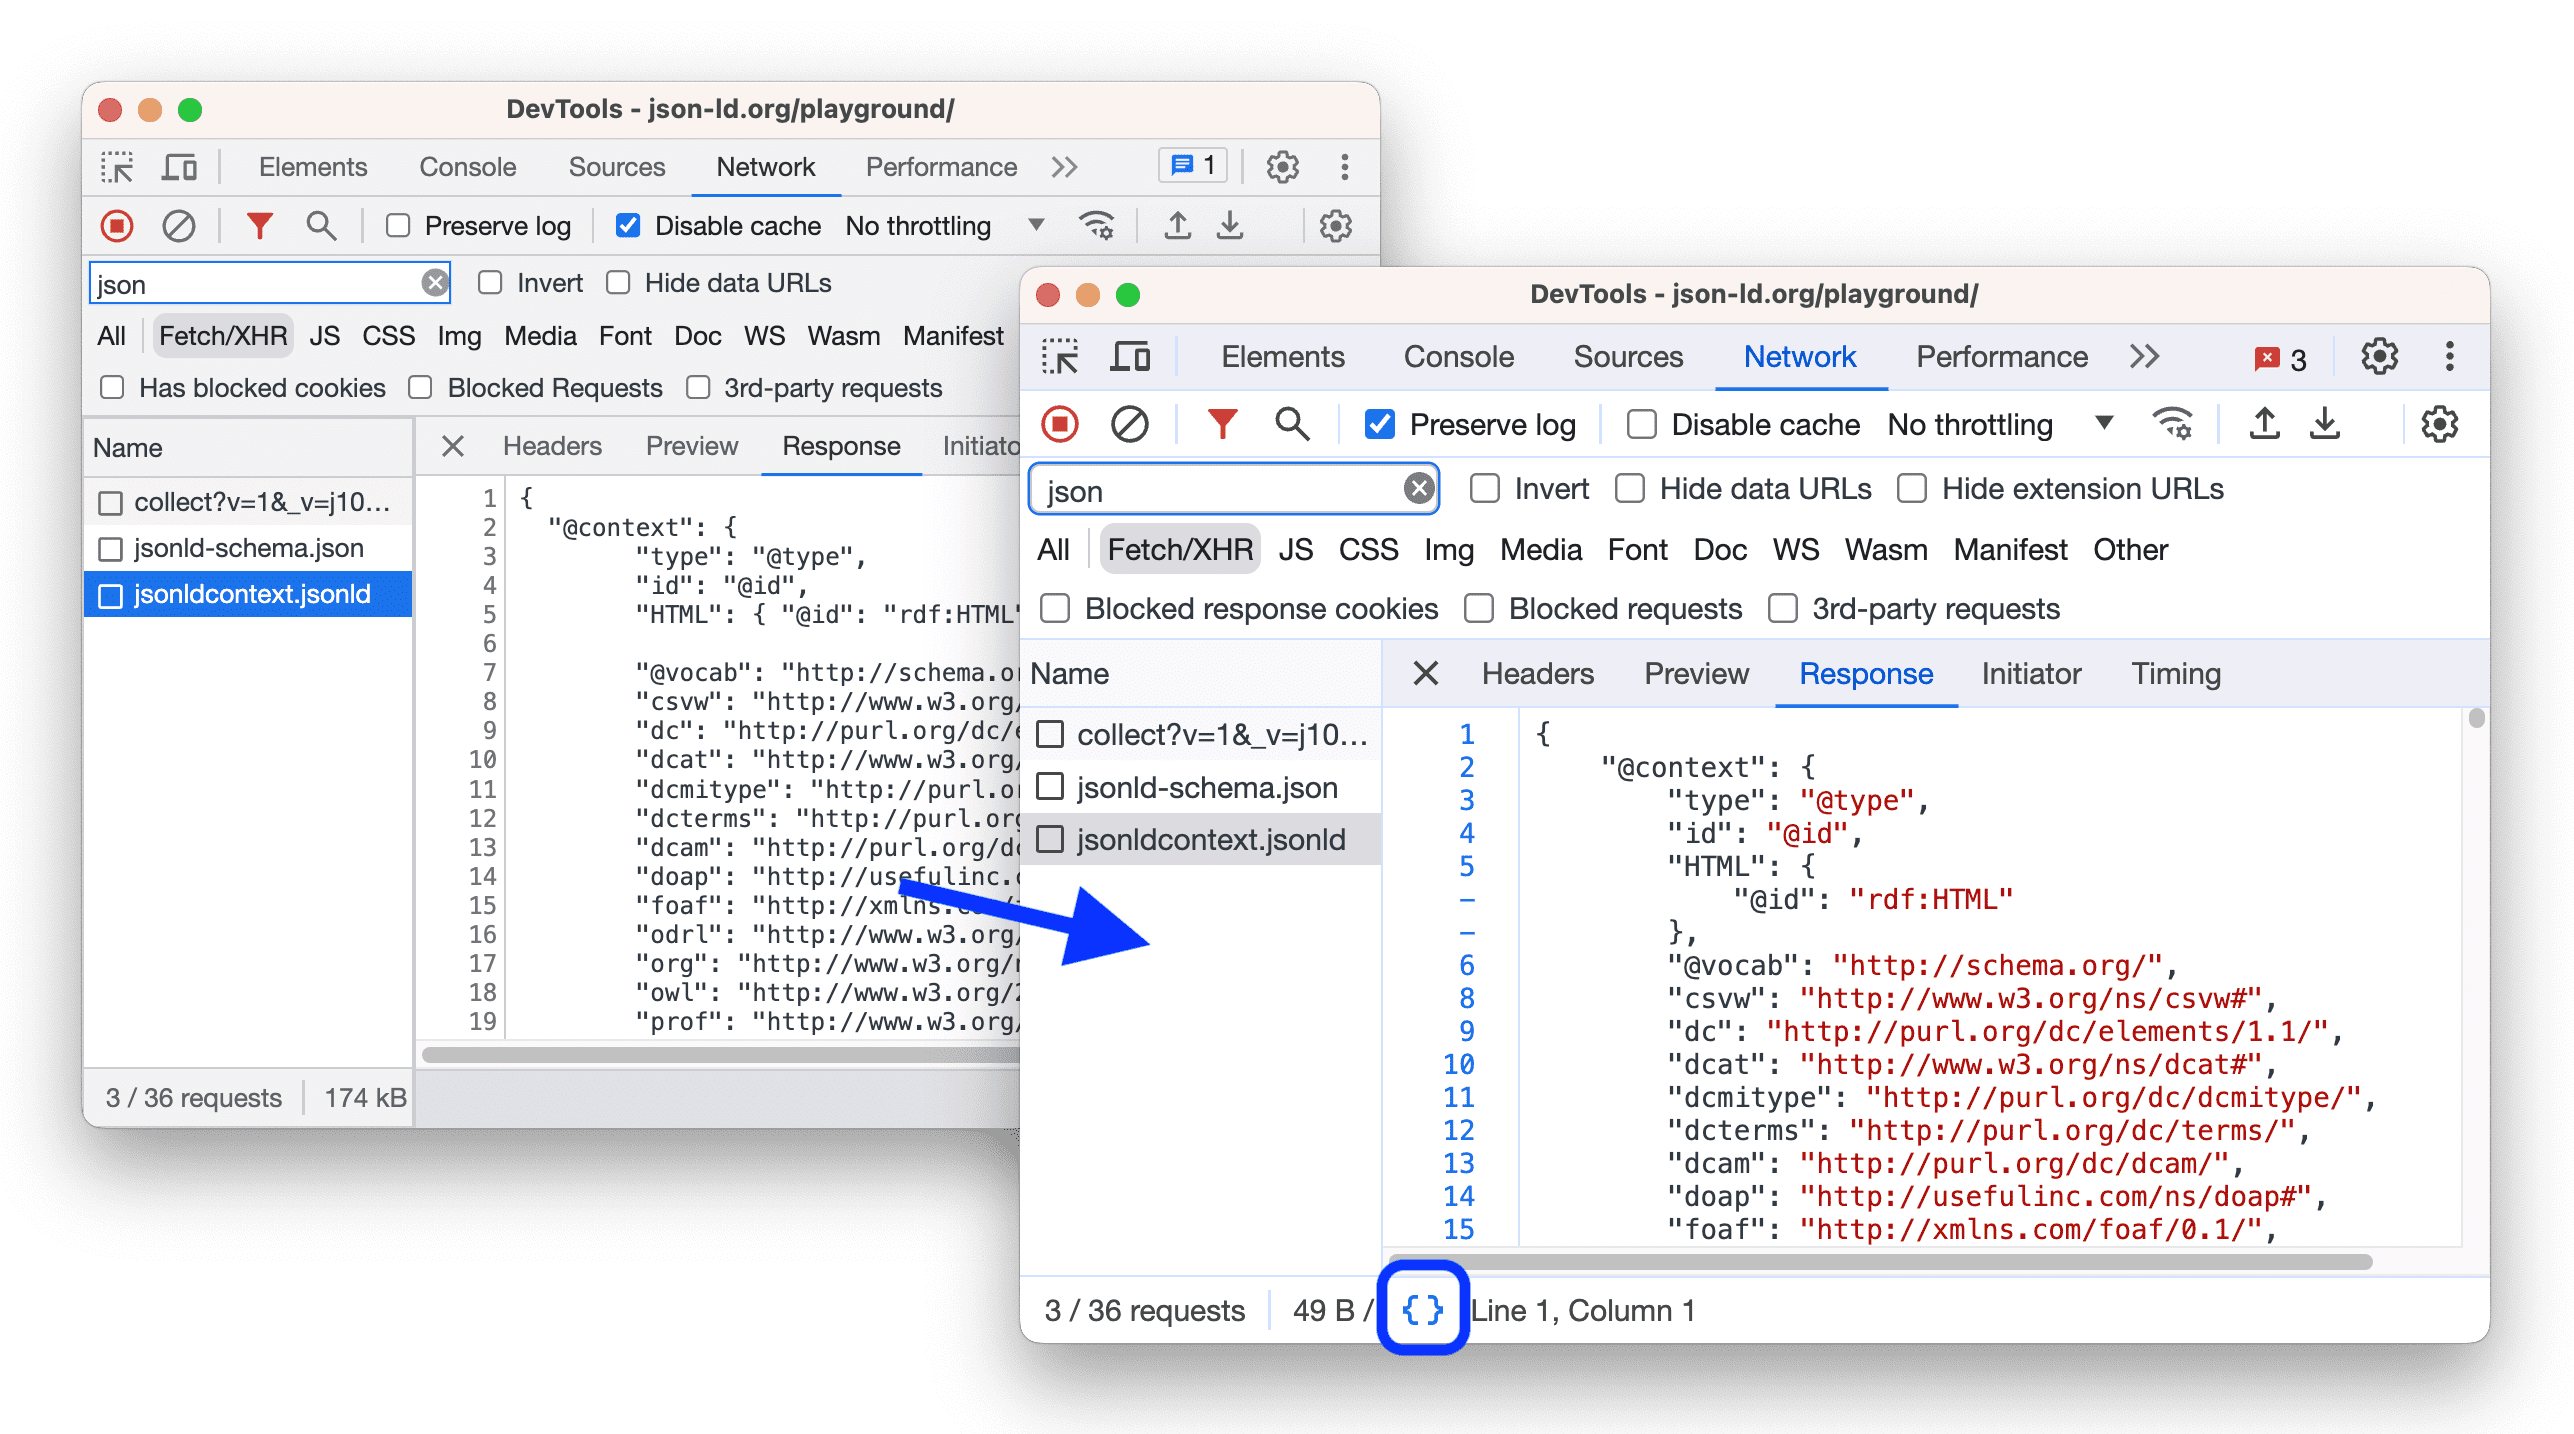
Pretty-print responses for JSON subtypes
The Response tab of for a request with a application/[subtype]+json MIME subtype (for example, ld+json, hal+json, and others) now parses the response correctly and lets you prettify it.
Chromium issue: 406900.
Performance: See the changes in fetch priority for network events
The Performance panel now shows two priority fields in the Summary of an event in the Network track: Initial Priority and (final) Priority, instead of just the singe Priority. With this additional field you can now see if the event's fetch priority changes and tweak the order of downloads. For more information, see Optimizing resource loading with the Fetch Priority API.

Additionally, you can find the same information in the Priority column of the Network panel, with the Big request rows setting enabled.

Chromium issues: 1463901, 1380964.
Sources settings enabled by default: Code folding and automatic file reveal
The Settings > Preferences >
Code folding option is now enabled by default. This option lets you fold code blocks.
To fold a code block, hover over the line number next to the start of the block and click the collapse icon. Click
{...} to expand the block again.
Moreover, the Settings > Preferences >
Automatically reveal files in the sidebar is now also enabled by default.
This setting makes the file tree in the Sources > Page select the current file open in the Editor when you switch tabs.
Chromium issues: 1459193, 1336599.
Improved debugging of third-party cookie issues
In an effort to help build a more private web and in parallel with updates by other browsers, Chrome introduced the Privacy Sandbox initiative. This initiative fundamentally enhances privacy on the web and can sustain a healthy, ad-supported web in a way that will render third-party cookies obsolete. Privacy Sandbox has a gradual phaseout timeline to let you adapt to changes comfortably.
You can already test how Chrome behaves after the third-party cookie phaseout. To do this, run Chrome from the command line with the --test-third-party-cookies-phaseout flag. To learn what this flag does, see Debugging cookies.
Regardless of the way you run Chrome (with or without the flag), the Issues tab now has the Include third-party cookie issues checkbox enabled by default for all new Chrome users and, as a result, reports:
- A breaking change warning about the upcoming phaseout.
- Issues related to third-party cookies.
If want to see cookie warnings about the upcoming phaseout as an existing Chrome user, make sure to check this checkbox.
To test this, inspect cookies at this demo page.

Additionally, the Blocked response cookies filter in the Network panel has been rephrased to make it clear that it shows only the blocked response cookies.

Chromium issues: 1458839, 1462693, 1466310.
Debug preloading in the Application panel
The Chrome team is bringing back full prerendering of future pages that a user is likely to navigate to. To let you debug this, DevTools adds the Preloading section to the Application panel. The new prefetching and prerendering (collectively known as "navigational preloading") uses the Speculation Rules API rather than to the link-based resource hints.
On this prerender demo page, in the Application > Preloading section, you can inspect:
- Speculation Rules that lists all the rule sets found on the current page.
- Preloads that lists all the prefetched and prerendered URLs from the rule sets.
- This Page that lists the prerendered status of the current page.
For more information, refer to the dedicated post on debugging speculation rules.
Chromium issue: 1410709.
New colors
You might have already noticed that DevTools now has a refreshed look that better aligns with Chrome. One contributing factor is the new color scheme.

This version (117) brings more UX improvements to DevTools, both already mentioned and listed further, including a number of improved UI texts.
Chromium issue: 1456677.
Lighthouse 10.4.0
The Lighthouse panel now runs Lighthouse 10.4.0. Most notably, this version adds new accessibility audits for the following:
For example:

See also the full list of changes. To learn the basics of using the Lighthouse panel in DevTools, see Lighthouse: Optimize website speed.
Chromium issue: 772558.
The C/C++ WebAssembly debugging extension for DevTools is now open source
The C/C++ WebAssembly debugging extension for DevTools is now open source and resides in the DevTools frontend repository. This extension enables debugging capabilities in DevTools for C++ programs compiled to WebAssembly. For more information, see Debug C/C++ WebAssembly.
Learn how to build, run, and test the extension and feel free to contribute.
Chromium issue: 1410709.
Miscellaneous highlights
These are some noteworthy fixes and improvements in this release:
- CSS Nesting: The Elements panel now shows the entire selector chain for nested children (1172985).
- Application > Manifest now has a Window Controls Overlay section that checks if a
display_overridevalue is present in the Manifest and provides links to relevant documentation. - The Sources > Page tree now does the following, including but not limited to (1442863):
- Greys out folders if all their content is ignore-listed.
- Colors folders in orange if all their content is from a source map.
- Performance: Capture Settings now automatically hide when you start the recording (1455498).
- Sources > Editor restored the Ctrl + Arrow behavior (Win) and Opt + Arrow (MacOs) (1468208).
- Animations > Pause all toggle now keeps its state across page loads (1446046).
- Application > Storage > Cache storage moved to the Application > Storage > Cache section (1462622).
- Some UI texts and tooltips are improved: Hardware concurrency tooltip, Network filter texts and a main menu option, capitalization in the Application tree view, Network > Headers texts, Sources > Overrides and Filesystem texts.
New experimental features
New rendering emulation: prefers-reduced-transparency
Your website users may start enabling the new experimental prefers-reduced-transparency CSS media feature on their devices to indicate their preference to reduce transparent effects. You might consider taking this preference into account to increase your website's accessibility. To help you, the Rendering drawer tab can now emulate the prefers-reduced-transparency: reduce setting, so you can prototype a solution and test how your website behaves in this case.
To test this feature in Chrome, enable Experimental Web Platform features in chrome://flags.
Chromium issue: 1424879.
Enhanced Protocol monitor
Chrome DevTools uses the Chrome DevTools Protocol (CDP) to instrument, inspect, debug, and profile Chrome browsers. If you are a Chromium or DevTools developer, the Protocol monitor provides you with a way to view all the CDP requests and responses made by DevTools and send CDP commands.
The Protocol monitor gets a new interface to let you construct and send CDP commands easier. Now you don't have to look up commands and their parameters in documentation, DevTools will suggest them to you.
In the bottom right corner of the Protocol monitor drawer tab, click Show CDP command editor, select a target, start typing a command, select one of the suggested, if required, specify parameter values, and click
Send command (Ctrl/Cmd + Enter).

Chromium issue: 1469345.
Download the preview channels
Consider using the Chrome Canary, Dev, or Beta as your default development browser. These preview channels give you access to the latest DevTools features, let you test cutting-edge web platform APIs, and help you find issues on your site before your users do!
Get in touch with the Chrome DevTools team
Use the following options to discuss the new features, updates, or anything else related to DevTools.
- Submit feedback and feature requests to us at crbug.com.
- Report a DevTools issue using the More options > Help > Report a DevTools issue in DevTools.
- Tweet at @ChromeDevTools.
- Leave comments on What's new in DevTools YouTube videos or DevTools Tips YouTube videos.
What's new in DevTools
A list of everything that has been covered in the What's new in DevTools series.
- DevTools MCP server updates
- Improved trace sharing
- Support for @starting-style
- Editor widget for display: masonry
- Lighthouse 13
- Code suggestions from Gemini
- Enhancements for the DevTools MCP server
- Quicker access to AI assistance
- Debug the full performance trace with Gemini
- Toggle drawer orientation
- Google Developer Program
- Miscellaneous highlights
- Chrome DevTools (MCP) for your AI agent
- Debug the network dependency tree with Gemini
- Export your chats with Gemini
- Persisted track configuration in the Performance panel
- Filter IP protected network requests
- Elements > Layout tab adds masonry layout support
- Lighthouse 12.8.2
- Miscellaneous highlights
- Debug more insights with Gemini
- Emulate the 'Save-Data' header in 'Network conditions'
- See the Baseline status in a CSS property tooltip
- Override form factors in user agent client hints
- Lighthouse 12.8.0
- Miscellaneous highlights
- A more reliable and productive Chrome DevTools
- Upload images in AI assistance for styling
- Add request headers to the table in Network
- Check out the highlights from Google I/O 2025
- Miscellaneous highlights
- Performance panel improvements
- Preconnected origins in 'Network dependency tree' insight
- Server response and redirection times in 'Document request latency' insight
- Redirects in Summary of network requests
- Reduced noise in the performance trace
- Deprecated 'Disable JavaScript samples'
- Geolocation accuracy parameter in Sensors
- Elements panel improvements
- Debug complex CSS values easier
- @function support in Elements > Styles
- Network panel improvements
- has-request-header filter
- Direct Sockets in Isolated Web Apps
- Miscellaneous highlights
- Accessibility
- Google I/O 2025 edition
- Modify and save CSS changes to your workspace with Gemini
- Connect a workspace folder and save changes back to your source files
- Ask Gemini about performance insights
- Annotate performance findings with Gemini
- Add screenshots to your chats with Gemini
- New insights in the Performance panel
- Duplicated JavaScript
- Legacy JavaScript
- Speculations now support rule tags
- Lighthouse 12.6.0
- Miscellaneous highlights
- Accessibility
- Performance panel improvements
- New performance insights
- Click to highlight
- Server timings in Summary of network requests
- Filter cookies in 'Privacy and security'
- Sizes in kB units in tables across panels
- Autocomplete supports corner-shape and corner-*-shape in Elements > Styles
- Experimental: Highlighting issues with elements and attributes in DOM
- Lighthouse 12.5.0
- Miscellaneous highlights
- Performance panel improvements
- Origin and script links for profile and function calls in Performance
- LCP by phase field data support
- Network dependency tree insight
- Duration instead of total and self time in Summary
- Heaviest stack highlighting
- Improved empty states for various panels
- Accessibility tree view in Elements
- Lighthouse 12.4.0
- Miscellaneous highlights
- Privacy and security panel
- Performance panel improvements
- Calibrated CPU throttling presets
- Select different performance events in the same AI chat
- First- and third-party highlighting in Performance
- Field data in marker tooltips and insights
- Forced reflow insight
- 'Optimize DOM size' insight
- Extend the performance trace with console.timeStamp
- Elements panel improvements
- Real-time values of animated styles
- Support for :open pseudo-class and various pseudo-elements
- Copy all console messages
- Byte units in the Memory panel
- Miscellaneous highlights
- Persistent AI chat history
- Performance panel improvements
- Image delivery insight
- Classic and modern keyboard navigation
- Ignore irrelevant scripts in the flame chart
- Timeline marker and range highlighting on hover
- Recommended throttling settings
- Timings markers in an overlay
- Stack traces of JS calls in Summary
- Badge settings moved to menu in Elements
- New 'What's new' panel
- Lighthouse 12.3.0
- Miscellaneous highlights
- Debug network requests, source files, and performance traces with Gemini
- View AI chat history
- Manage extension storage in Application > Storage
- Performance improvements
- Interaction phases in live metrics
- Render blocking information in the Summary tab
- Support for scheduler.postTask events and their initiator arrows
- Animations panel and Elements > Styles tab improvements
- Jump from Elements > Styles to Animations
- Real-time updates in Computed tab
- Compute pressure emulation in Sensors
- JS objects with the same name grouped by source in the Memory panel
- A new look for settings
- Performance insights panel is deprecated and removed from DevTools
- Miscellaneous highlights
- Debug CSS with Gemini
- Control AI features in a dedicated settings tab
- Performance panel improvements
- Annotate and share performance findings
- Get performance insights right in the Performance panel
- Spot excessive layout shifts easier
- Spot the non-composited animations
- Hardware concurrency moves to Sensors
- Ignore anonymous scripts and focus on your code in stack traces
- Elements > Styles: Support for sideways-* writing modes for grid overlays and CSS-wide keywords
- Lighthouse audits for non-HTTP pages in timespan and snapshot modes
- Accessibility improvements
- Miscellaneous highlights
- Network panel improvements
- Network filters reimagined
- HAR exports now exclude sensitive data by default
- Elements panel improvements
- Autocomplete values for text-emphasis-* properties
- Scroll overflows marked with a badge
- Performance panel improvements
- Recommendations in live metrics
- Navigate breadcrumbs
- Memory panel improvements
- New 'Detached elements' profile
- Improved naming of plain JS objects
- Turn off dynamic theming
- Chrome Experiment: Process sharing
- Lighthouse 12.2.1
- Miscellaneous highlights
- Recorder supports export to Puppeteer for Firefox
- Performance panel improvements
- Live metrics observations
- Search requests in the Network track
- See stack traces of performance.mark and performance.measure calls
- Use test address data in the Autofill panel
- Elements panel improvements
- Force more states for specific elements
- Elements > Styles now autocompletes more grid properties
- Lighthouse 12.2.0
- Miscellaneous highlights
- Console insights by Gemini are going live in most European countries
- Performance panel updates
- Enhanced Network track
- Customize performance data with extensibility API
- Details in the Timings track
- Copy all listed requests in the Network panel
- Faster heap snapshots with named HTML tags and less clutter
- Open Animations panel to capture animations and edit @keyframes live
- Lighthouse 12.1.0
- Accessibility improvements
- Miscellaneous highlights
- Inspect CSS anchor positioning in the Elements panel
- Sources panel improvements
- Enhanced 'Never Pause Here'
- New scroll snap event listeners
- Network panel improvements
- Updated network throttling presets
- Service worker information in custom fields of the HAR format
- Send and receive WebSocket events in the Performance panel
- Miscellaneous highlights
- Performance panel improvements
- Move and hide tracks with updated track configuration mode
- Ignore scripts in the flame chart
- Throttle down the CPU by 20 times
- Performance insights panel will be deprecated
- Find excessive memory usage with new filters in heap snapshots
- Inspect storage buckets in Application > Storage
- Disable self-XSS warnings with a command-line flag
- Lighthouse 12.0.0
- Miscellaneous highlights
- Understand errors and warnings in the Console better with Gemini
- @position-try rules support in Elements > Styles
- Sources panel improvements
- Configure automatic pretty-printing and bracket closing
- Handled rejected promises are recognized as caught
- Error causes in the Console
- Network panel improvements
- Inspect Early Hints headers
- Hide the Waterfall column
- Performance panel improvements
- Capture CSS selector statistics
- Change order and hide tracks
- Ignore retainers in the Memory panel
- Lighthouse 11.7.1
- Miscellaneous highlights
- New Autofill panel
- Enhanced network throttling for WebRTC
- Scroll-driven animations support in the Animations panel
- Improved CSS nesting support in Elements > Styles
- Enhanced Performance panel
- Hide functions and their children in the flame chart
- Arrows from selected initiators to events they initiated
- Lighthouse 11.6.0
- Tooltips for special categories in Memory > Heap snapshots
- Application > Storage updates
- Bytes used for shared storage
- Web SQL is fully deprecated
- Coverage panel improvements
- The Layers panel might be deprecated
- JavaScript Profiler deprecation: Phase four, final
- Miscellaneous highlights
- Find the Easter egg
- Elements panel updates
- Emulate a focused page in Elements > Styles
- Color Picker, Angle Clock, and Easing Editor in
var()fallbacks - CSS length tool is deprecated
- Popover for the selected search result in the Performance > Main track
- Network panel updates
- Clear button and search filter in the Network > EventStream tab
- Tooltips with exemption reasons for third-party cookies in Network > Cookies
- Enable and disable all breakpoints in Sources
- View loaded scripts in DevTools for Node.js
- Lighthouse 11.5.0
- Accessibility improvements
- Miscellaneous highlights
- The official collection of Recorder extensions is live
- Network improvements
- Failure reason in the Status column
- Improved Copy submenu
- Performance improvements
- Breadcrumbs in the Timeline
- Event initiators in the Main track
- JavaScript VM instance selector menu for Node.js DevTools
- New shortcut and command in Sources
- Elements improvements
- The ::view-transition pseudo-element is now editable in Styles
- The align-content property support for block containers
- Posture support for emulated foldable devices
- Dynamic theming
- Third-party cookies phaseout warnings in the Network and Application panels
- Lighthouse 11.4.0
- Accessibility improvements
- Miscellaneous highlights
- Elements improvements
- Streamlined filter bar in the Network panel
@font-palette-valuessupport- Supported case: Custom property as a fallback of another custom property
- Improved source map support
- Performance panel improvements
- Enhanced Interactions track
- Advanced filtering in Bottom-Up, Call Tree, and Event Log tabs
- Indentation markers in the Sources panel
- Helpful tooltips for overridden headers and content in the Network panel
- New Command Menu options for adding and removing request blocking patterns
- The CSP violations experiment is removed
- Lighthouse 11.3.0
- Accessibility improvements
- Miscellaneous highlights
- Third-party cookie phaseout
- Analyze your website's cookies with the Privacy Sandbox Analysis Tool
- Enhanced ignore listing
- Default exclusion pattern for node_modules
- Caught exceptions now stop execution if caught or passing through non-ignored code
x_google_ignoreListrenamed toignoreListin source maps- New input mode toggle during remote debugging
- The Elements panel now shows URLs for #document nodes
- Effective Content Security Policy in the Application panel
- Improved animation debugging
- 'Do you trust this code?' dialog in Sources and self-XSS warning in Console
- Event listener breakpoints in web workers and worklets
- The new media badge for
<audio>and<video> - Preloading renamed to Speculative loading
- Lighthouse 11.2.0
- Accessibility improvements
- Miscellaneous highlights
- Improved @property section in Elements > Styles
- Editable @property rule
- Issues with invalid @property rules are reported
- Updated list of devices to emulate
- Pretty-print inline JSON in script tags in Sources
- Autocomplete private fields in Console