
Override network response headers
You can now override response headers in the Network panel. Previously, you needed access to the web server to experiment with HTTP response headers.
With response header overrides, you can locally prototype fixes for various headers, including but not limited to:
- Cross-Origin Resource Sharing (CORS) Headers
- Permissions-Policy Headers
- Cross-Origin Isolation Headers
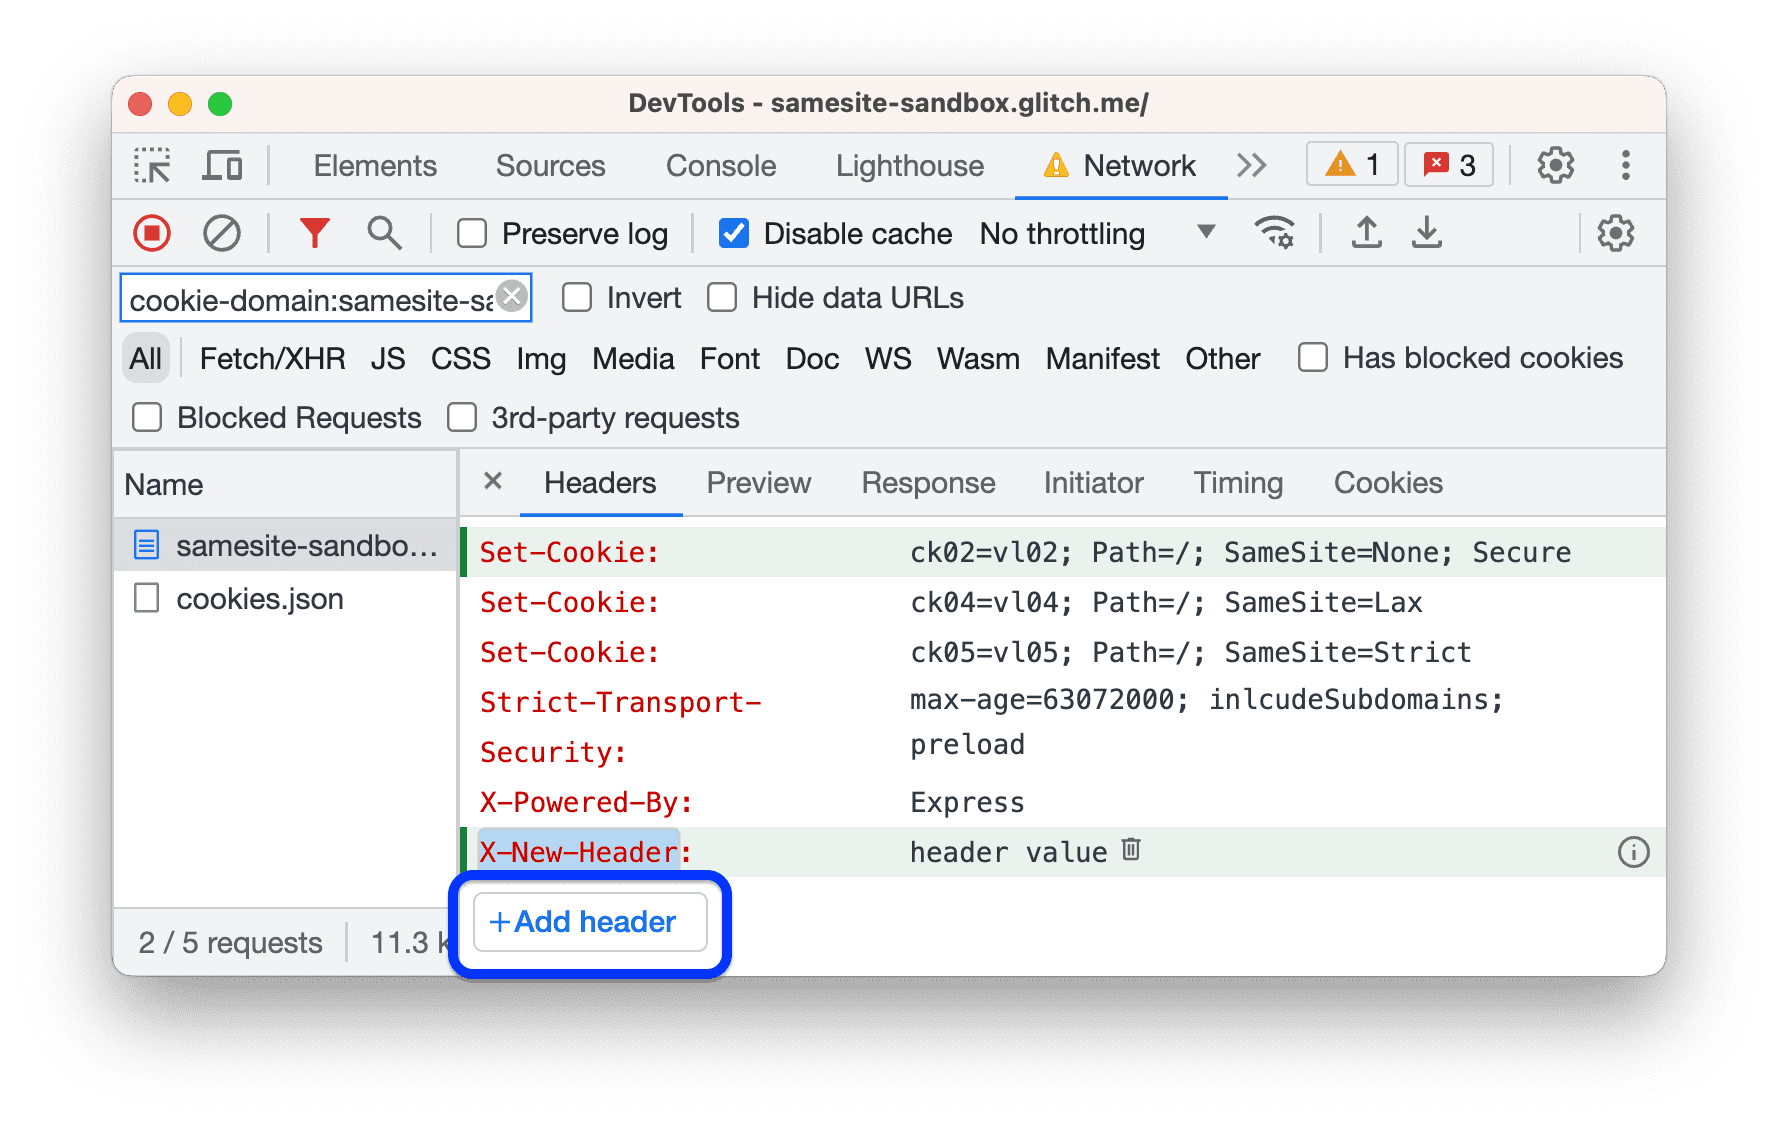
To override a header, navigate to Network > Headers > Response Headers, hover over a header's value, click and edit it.

You can also add custom headers.
To edit all overrides in a single place, edit the .headers file in Sources > Overrides. There, you can also click Add override rule to override multiple requests using wildcards (*).

Chromium issue: 1288023.
Nuxt, Vite, and Rollup debugging improvements
To help you pinpoint issues quicker during debugging, the enhanced stack trace now hides frames that come from sources generated by Nuxt 3.3 or later. DevTools skips such frames:
- In Console traces, under the Show N more frames link.
- In Sources > Call Stack, under
Show ignore-listed frames.

To bring you these improvements, the DevTools, Nuxt, Vite, and Rollup teams collaborated to adopt the x_google_ignoreList source map extension:
The DevTools team would like to express gratitude to the Nuxt, Vite, and Rollup teams for making this possible. We appreciate your efforts and collaboration, which were essential to the success of this implementation. Thank you again for your contributions!
CSS improvements in Elements > Styles
Invalid CSS properties and values
To help you diagnose CSS issues faster, the Styles pane now crosses out:
- An entire CSS declaration (property and value) when the CSS property is invalid.
- Just the value when the CSS property is valid but the value is invalid.

The DevTools team would like to express gratitude to Yisi(一丝) for landing this improvement.
Links to key frames in the animation shorthand property
The animation shorthand CSS property now contains links to the corresponding @keyframes at-rules, so you can navigate the Styles pane faster.

Chromium issue: 1420656.
New Console setting: Autocomplete on Enter
Starting with the previous version (112), you can configure the DevTools Console to apply an autocomplete suggestion when you press Enter.
By default, to accept an autocomplete suggestion, you can press Tab or Arrow right. To also autocomplete with Enter, enable Settings > Console >
Accept autocomplete suggestion on Enter.

Additionally, the text of another setting is now more user-friendly: Treat code evaluation as user action.
Chromium issue: 1276960.
Command Menu emphasizes authored files
The quick open dialog in the Command Menu now grays out the ignore-listed third-party files to put more emphasis on the files you authored.

Chromium issue: 1424345.
JavaScript Profiler deprecation: Stage two
As early as Chrome 58, the DevTools team planned to eventually deprecate the JavaScript Profiler and have Node.js and Deno developers use the Performance panel for profiling JavaScript CPU performance.
DevTools version 113 starts phase two of the four-phase JavaScript Profiler deprecation. During this phase, you can still open the panel but its UI is no longer available.
To profile CPU performance, click Go to Performance panel.

Chromium issue: 1354548.
Miscellaneous highlights
These are some noteworthy fixes in this release:
- Fixed a bug that caused pretty-printing in the Sources panel to handle variable names with Unicode characters incorrectly (1425055).
- The Issues tab added a new message for Autofill issues regarding non-standard HTML values (1399414).
Download the preview channels
Consider using the Chrome Canary, Dev, or Beta as your default development browser. These preview channels give you access to the latest DevTools features, let you test cutting-edge web platform APIs, and help you find issues on your site before your users do!
Get in touch with the Chrome DevTools team
Use the following options to discuss the new features, updates, or anything else related to DevTools.
- Submit feedback and feature requests to us at crbug.com.
- Report a DevTools issue using the More options > Help > Report a DevTools issue in DevTools.
- Tweet at @ChromeDevTools.
- Leave comments on What's new in DevTools YouTube videos or DevTools Tips YouTube videos.
What's new in DevTools
A list of everything that has been covered in the What's new in DevTools series.
- DevTools MCP server updates
- Improved trace sharing
- Support for @starting-style
- Editor widget for display: masonry
- Lighthouse 13
- Code suggestions from Gemini
- Enhancements for the DevTools MCP server
- Quicker access to AI assistance
- Debug the full performance trace with Gemini
- Toggle drawer orientation
- Google Developer Program
- Miscellaneous highlights
- Chrome DevTools (MCP) for your AI agent
- Debug the network dependency tree with Gemini
- Export your chats with Gemini
- Persisted track configuration in the Performance panel
- Filter IP protected network requests
- Elements > Layout tab adds masonry layout support
- Lighthouse 12.8.2
- Miscellaneous highlights
- Debug more insights with Gemini
- Emulate the 'Save-Data' header in 'Network conditions'
- See the Baseline status in a CSS property tooltip
- Override form factors in user agent client hints
- Lighthouse 12.8.0
- Miscellaneous highlights
- A more reliable and productive Chrome DevTools
- Upload images in AI assistance for styling
- Add request headers to the table in Network
- Check out the highlights from Google I/O 2025
- Miscellaneous highlights
- Performance panel improvements
- Preconnected origins in 'Network dependency tree' insight
- Server response and redirection times in 'Document request latency' insight
- Redirects in Summary of network requests
- Reduced noise in the performance trace
- Deprecated 'Disable JavaScript samples'
- Geolocation accuracy parameter in Sensors
- Elements panel improvements
- Debug complex CSS values easier
- @function support in Elements > Styles
- Network panel improvements
- has-request-header filter
- Direct Sockets in Isolated Web Apps
- Miscellaneous highlights
- Accessibility
- Google I/O 2025 edition
- Modify and save CSS changes to your workspace with Gemini
- Connect a workspace folder and save changes back to your source files
- Ask Gemini about performance insights
- Annotate performance findings with Gemini
- Add screenshots to your chats with Gemini
- New insights in the Performance panel
- Duplicated JavaScript
- Legacy JavaScript
- Speculations now support rule tags
- Lighthouse 12.6.0
- Miscellaneous highlights
- Accessibility
- Performance panel improvements
- New performance insights
- Click to highlight
- Server timings in Summary of network requests
- Filter cookies in 'Privacy and security'
- Sizes in kB units in tables across panels
- Autocomplete supports corner-shape and corner-*-shape in Elements > Styles
- Experimental: Highlighting issues with elements and attributes in DOM
- Lighthouse 12.5.0
- Miscellaneous highlights
- Performance panel improvements
- Origin and script links for profile and function calls in Performance
- LCP by phase field data support
- Network dependency tree insight
- Duration instead of total and self time in Summary
- Heaviest stack highlighting
- Improved empty states for various panels
- Accessibility tree view in Elements
- Lighthouse 12.4.0
- Miscellaneous highlights
- Privacy and security panel
- Performance panel improvements
- Calibrated CPU throttling presets
- Select different performance events in the same AI chat
- First- and third-party highlighting in Performance
- Field data in marker tooltips and insights
- Forced reflow insight
- 'Optimize DOM size' insight
- Extend the performance trace with console.timeStamp
- Elements panel improvements
- Real-time values of animated styles
- Support for :open pseudo-class and various pseudo-elements
- Copy all console messages
- Byte units in the Memory panel
- Miscellaneous highlights
- Persistent AI chat history
- Performance panel improvements
- Image delivery insight
- Classic and modern keyboard navigation
- Ignore irrelevant scripts in the flame chart
- Timeline marker and range highlighting on hover
- Recommended throttling settings
- Timings markers in an overlay
- Stack traces of JS calls in Summary
- Badge settings moved to menu in Elements
- New 'What's new' panel
- Lighthouse 12.3.0
- Miscellaneous highlights
- Debug network requests, source files, and performance traces with Gemini
- View AI chat history
- Manage extension storage in Application > Storage
- Performance improvements
- Interaction phases in live metrics
- Render blocking information in the Summary tab
- Support for scheduler.postTask events and their initiator arrows
- Animations panel and Elements > Styles tab improvements
- Jump from Elements > Styles to Animations
- Real-time updates in Computed tab
- Compute pressure emulation in Sensors
- JS objects with the same name grouped by source in the Memory panel
- A new look for settings
- Performance insights panel is deprecated and removed from DevTools
- Miscellaneous highlights
- Debug CSS with Gemini
- Control AI features in a dedicated settings tab
- Performance panel improvements
- Annotate and share performance findings
- Get performance insights right in the Performance panel
- Spot excessive layout shifts easier
- Spot the non-composited animations
- Hardware concurrency moves to Sensors
- Ignore anonymous scripts and focus on your code in stack traces
- Elements > Styles: Support for sideways-* writing modes for grid overlays and CSS-wide keywords
- Lighthouse audits for non-HTTP pages in timespan and snapshot modes
- Accessibility improvements
- Miscellaneous highlights
- Network panel improvements
- Network filters reimagined