
New Autofill panel
This version brings the new Autofill panel to DevTools. Chrome Autofill provides a convenient way to automatically fill forms on websites with saved addresses. The new Autofill panel lets you inspect the mapping between your form fields, predicted autofill values, and saved data.
Try the new panel on this demo page with test data:
- In Profile Autofill, click any of the Fill form ... buttons, click Submit, then, in the Save address? dialog window, click Save, and go back to the page with the form.
- Open DevTools and trigger an autofill event: select a form field and choose the address from the drop-down list.
The Autofill panel opens automatically and shows you detected form fields, fields the autofill inferred, and saved values.

To learn more, see Learn Forms and Autofill.
Enhanced network throttling for WebRTC
With the fresh addition of packet-related parameters to custom network throttling profiles, you can now throttle your WebRTC applications right in DevTools. This is useful to test your real-time communication implementation, without the need to use third-party software.
The new parameters are: Packet Loss (percent), Packet Queue Length (number of packets), and the Packet Reordering flag.
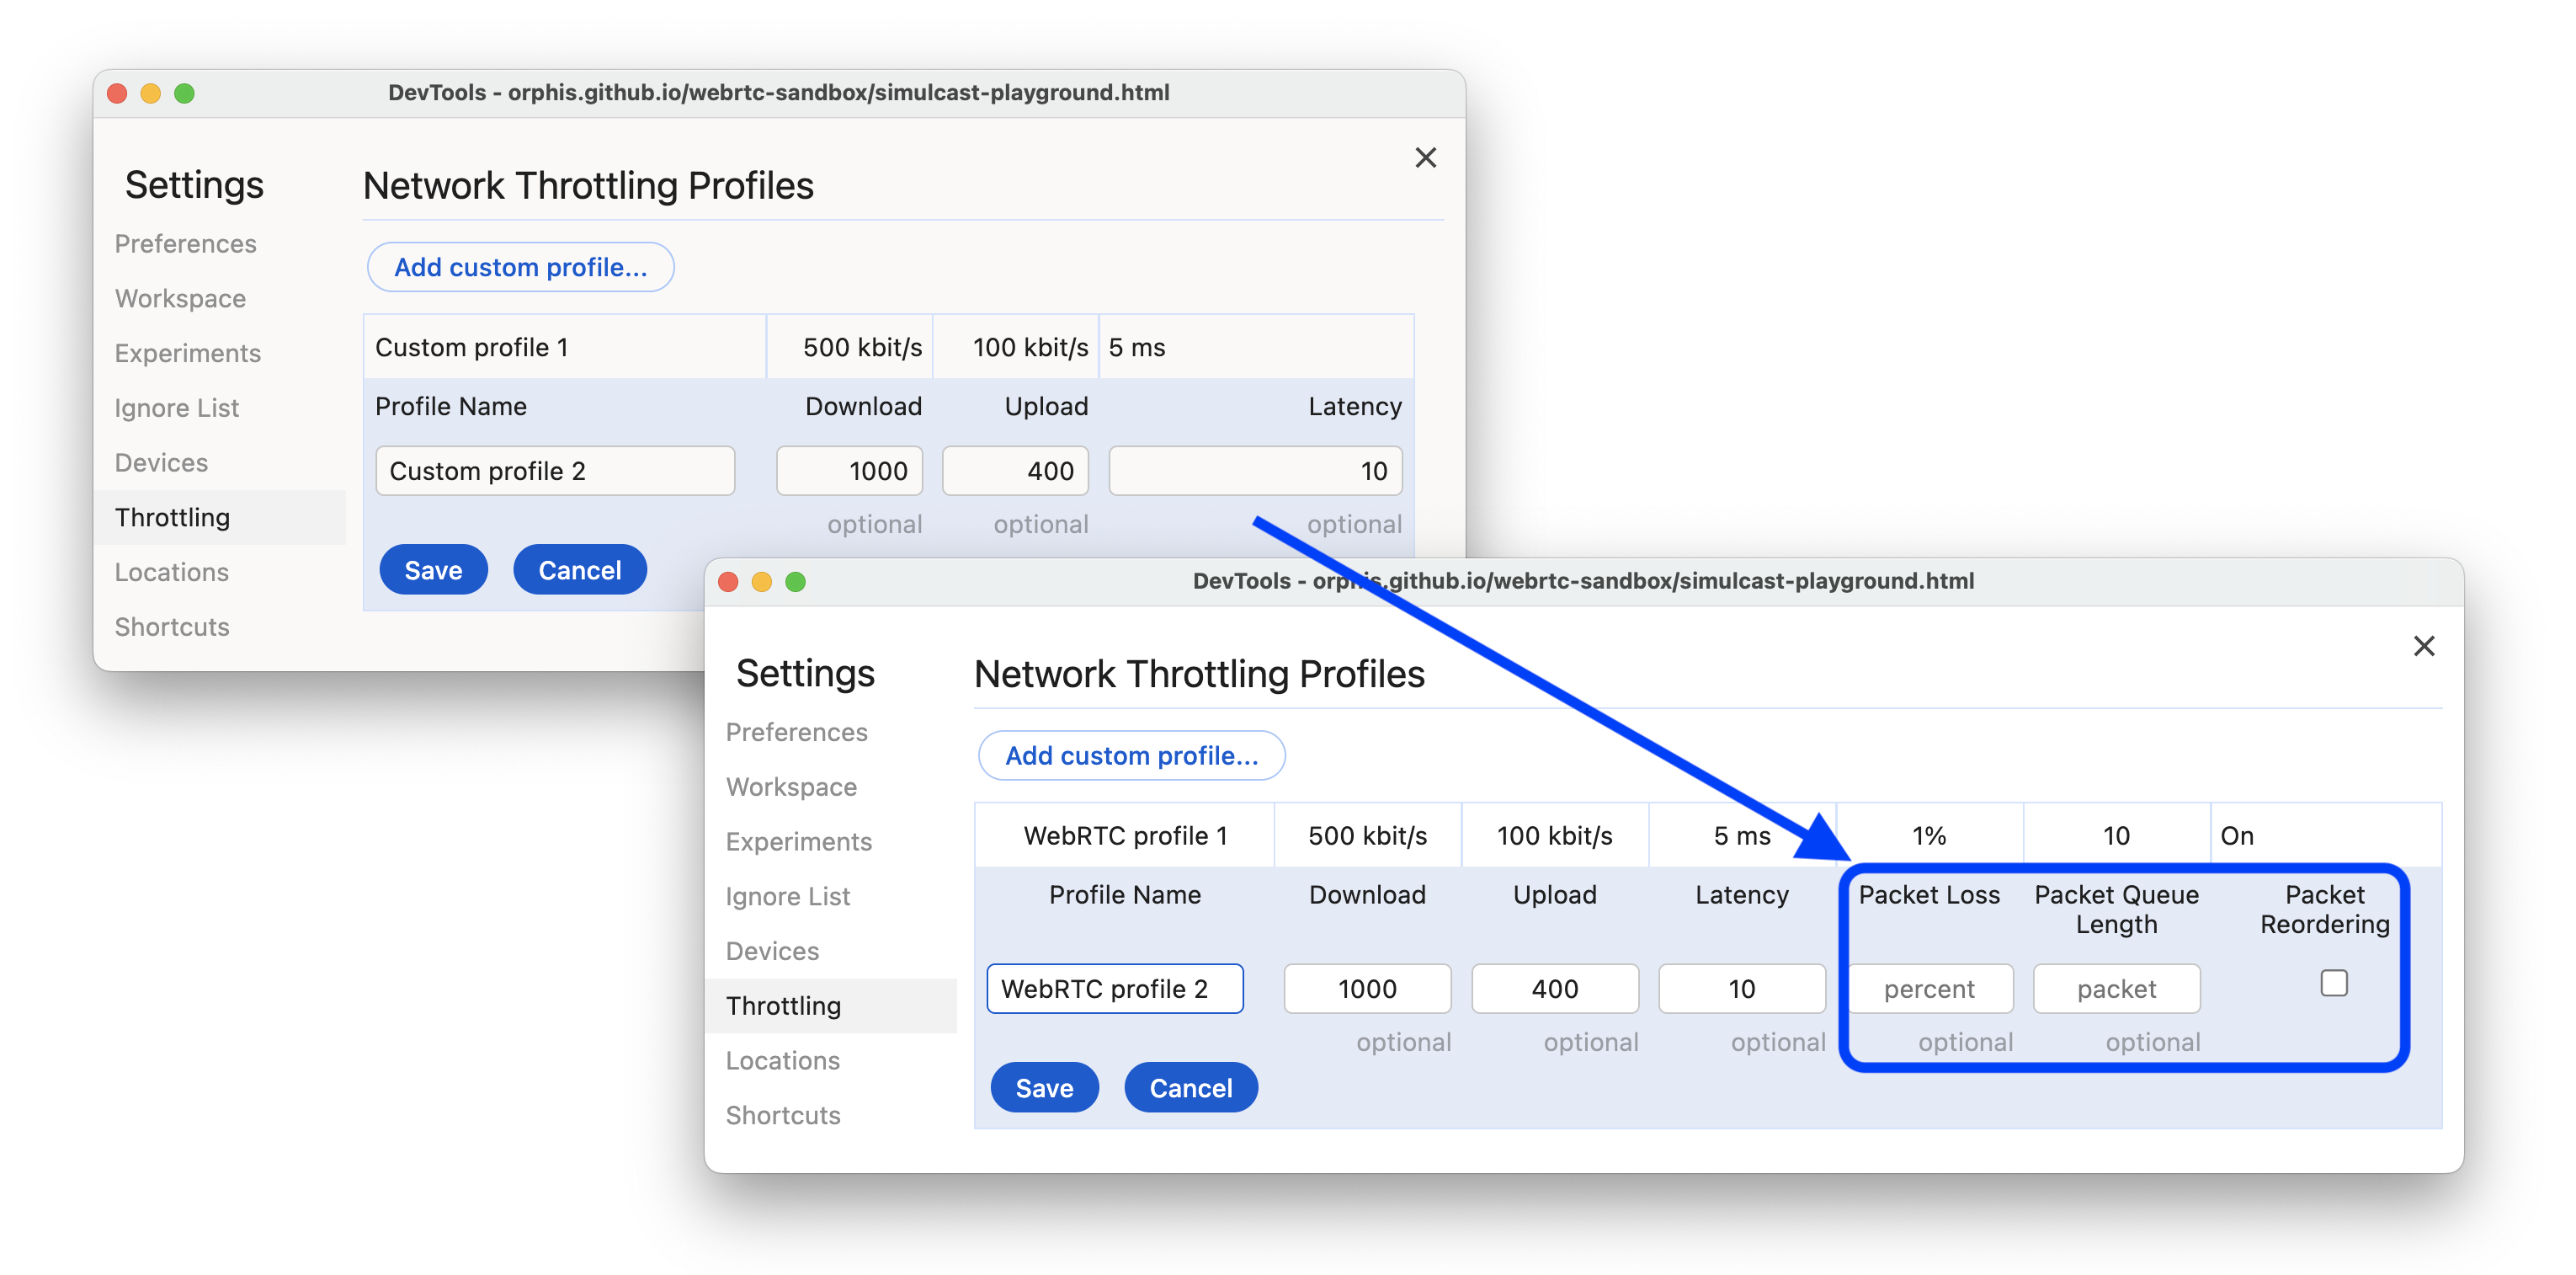
To throttle a WebRTC connection, specify the packet-related parameters in a custom profile in Settings > Throttling and select it in the Network panel.
Try the new parameters on this demo page. First, allow the page to use the camera. Then, in the Network panel, select the custom profile you configured, and, back on the page, click Start and Call.
Chromium issue: 41175925.
Scroll-driven animations support in the Animations panel
The Animations panel now lets you inspect scroll-driven animations.
Try this feature on this demo page. Open the Animations panel and reload the page to capture scroll-driven animations.

An animation group marked with a mouse icon appears in the Overview. You can now inspect it. The group shows pixel values instead of milliseconds in the Timeline.
Improved CSS nesting support in Elements > Styles
The Elements > Styles tab improves CSS nesting support and now shows nested styles with indentation and in braces. CSS nesting is a way to group CSS rules together and make things less verbose and more structured.

Chromium issue: 40166888.
Enhanced Performance panel
This version brings several improvements to the Performance panel.
Hide functions and their children in the flame chart
To filter out the noise from the flame chart in Performance > Main, you can now hide irrelevant functions and their children. In the flame chart, right-click a function and choose an option from the context menu.

Functions with hidden children have a Drop-down button on the right. Hover over it to see the number of hidden children and click it to show them again. To return to the initial state of the flame chart, right-click a function and select Reset trace.
Arrows from selected initiators to events they initiated
Previously, when you selected and event in the Main track, the track showed an arrow from its initiator to the selected event. Now, the track also shows an arrow from the selected event to the one it initiated, if any.

Additionally, all initiators now have Initiator for fields in the Summary tab and both Initiator for and Initiated by fields have named links instead of Reveal.
Chromium issues: 325604258, 325024819, 326055289.
Lighthouse 11.6.0
The Lighthouse panel now runs Lighthouse 11.6.0. See the full list of changes.
Among notable changes is the new opt-in Enable JS sampling setting. This setting is disabled by default.

Enabling JS sampling adds detailed JavaScript call stacks to the performance trace but may slow down report generation.

The trace is available under Tools menu > View Unthrottled Trace after the Lighthouse report is generated.
To learn the basics of using the Lighthouse panel in DevTools, see Lighthouse: Optimize website speed.
Chromium issue: 772558.
Tooltips for special categories in Memory > Heap snapshots
Heap snapshots in the Memory panel have special groups of objects that aren't based on constructors. When you hover over such objects, the Memory panel now shows you a tooltip with a short description and a link to a longer description in documentation.

Chromium issue: 41490331.
Application > Storage updates
This version brings a couple of updates to Application > Storage.
Bytes used for shared storage
The Application > Storage > Shared storage section now shows you the number of bytes used by an origin.

Shared storage lets you have unlimited, cross-site storage write access with privacy-preserving read access.
Chromium issue: 324464353.
Web SQL is fully deprecated
Chrome deprecated Web SQL in version 119 and removed the deprecation trial token in this version, so you can no longer use Web SQL.
Following suit, DevTools removed the Web SQL section from the Application panel.
Chromium issue: 327254049.
Coverage panel improvements
This version brings a couple of updates to the Coverage panel:
- The status bar now correctly calculates the usage statistics for filtered URLs. Previously, instead of adding up the usage data of children that matched the filter, it added up their parent's data.

- The color of used code is now gray instead of green to improve visibility, especially for no-green color vision deficiency.

Chromium issue: 41494198, 329253687.
The Layers panel might be deprecated
The Layers panel might be deprecated soon due to low usage. The panel now shows a warning banner at the top.

Feel free to share your thoughts and concerns before the team makes the final decision to deprecate the panel.
JavaScript Profiler deprecation: Phase four, final
In this version, the JS Profiler panel has been fully deprecated and can't be re-enabled anymore.
To profile CPU performance, use the Performance panel.
Chromium issue: 40262073.
Miscellaneous highlights
These are some noteworthy fixes and improvements in this release:
- Network:
- Performance monitor: Track checkboxes are now the same as in the rest of UI (1467464).
- Sources: Added syntax highlighting for XHTML documents (327940244).
- Settings > Devices: Old Galaxy Fold is replaced with newer Galaxy Z Fold 5 (40113439).
- Performance: All matched search results are now highlighted when searching with Ctrl/Cmd+F (1523279).
- Developer resources: Now also shows resources loaded through language extensions, such as C/C++ DevTools Support (DWARF) Chrome extension (40746829).
- Performance: Fixed cropped call stack and its bad layout in the Summary tab (325314708).
- Drawer: Close buttons are now focusable, so panels can be closed using the keyboard.
Download the preview channels
Consider using the Chrome Canary, Dev, or Beta as your default development browser. These preview channels give you access to the latest DevTools features, let you test cutting-edge web platform APIs, and help you find issues on your site before your users do!
Get in touch with the Chrome DevTools team
Use the following options to discuss the new features, updates, or anything else related to DevTools.
- Submit feedback and feature requests to us at crbug.com.
- Report a DevTools issue using the More options > Help > Report a DevTools issue in DevTools.
- Tweet at @ChromeDevTools.
- Leave comments on What's new in DevTools YouTube videos or DevTools Tips YouTube videos.
What's new in DevTools
A list of everything that has been covered in the What's new in DevTools series.
- DevTools MCP server updates
- Improved trace sharing
- Support for @starting-style
- Editor widget for display: masonry
- Lighthouse 13
- Code suggestions from Gemini
- Enhancements for the DevTools MCP server
- Quicker access to AI assistance
- Debug the full performance trace with Gemini
- Toggle drawer orientation
- Google Developer Program
- Miscellaneous highlights
- Chrome DevTools (MCP) for your AI agent
- Debug the network dependency tree with Gemini
- Export your chats with Gemini
- Persisted track configuration in the Performance panel
- Filter IP protected network requests
- Elements > Layout tab adds masonry layout support
- Lighthouse 12.8.2
- Miscellaneous highlights
- Debug more insights with Gemini
- Emulate the 'Save-Data' header in 'Network conditions'
- See the Baseline status in a CSS property tooltip
- Override form factors in user agent client hints
- Lighthouse 12.8.0
- Miscellaneous highlights
- A more reliable and productive Chrome DevTools
- Upload images in AI assistance for styling
- Add request headers to the table in Network
- Check out the highlights from Google I/O 2025
- Miscellaneous highlights
- Performance panel improvements
- Preconnected origins in 'Network dependency tree' insight
- Server response and redirection times in 'Document request latency' insight
- Redirects in Summary of network requests
- Reduced noise in the performance trace
- Deprecated 'Disable JavaScript samples'
- Geolocation accuracy parameter in Sensors
- Elements panel improvements
- Debug complex CSS values easier
- @function support in Elements > Styles
- Network panel improvements
- has-request-header filter
- Direct Sockets in Isolated Web Apps
- Miscellaneous highlights
- Accessibility
- Google I/O 2025 edition
- Modify and save CSS changes to your workspace with Gemini
- Connect a workspace folder and save changes back to your source files
- Ask Gemini about performance insights
- Annotate performance findings with Gemini
- Add screenshots to your chats with Gemini
- New insights in the Performance panel
- Duplicated JavaScript
- Legacy JavaScript
- Speculations now support rule tags
- Lighthouse 12.6.0
- Miscellaneous highlights
- Accessibility
- Performance panel improvements
- New performance insights
- Click to highlight
- Server timings in Summary of network requests
- Filter cookies in 'Privacy and security'
- Sizes in kB units in tables across panels
- Autocomplete supports corner-shape and corner-*-shape in Elements > Styles
- Experimental: Highlighting issues with elements and attributes in DOM
- Lighthouse 12.5.0
- Miscellaneous highlights
- Performance panel improvements
- Origin and script links for profile and function calls in Performance
- LCP by phase field data support
- Network dependency tree insight
- Duration instead of total and self time in Summary
- Heaviest stack highlighting
- Improved empty states for various panels
- Accessibility tree view in Elements
- Lighthouse 12.4.0
- Miscellaneous highlights
- Privacy and security panel
- Performance panel improvements
- Calibrated CPU throttling presets
- Select different performance events in the same AI chat
- First- and third-party highlighting in Performance
- Field data in marker tooltips and insights
- Forced reflow insight
- 'Optimize DOM size' insight
- Extend the performance trace with console.timeStamp
- Elements panel improvements
- Real-time values of animated styles
- Support for :open pseudo-class and various pseudo-elements
- Copy all console messages
- Byte units in the Memory panel
- Miscellaneous highlights
- Persistent AI chat history
- Performance panel improvements
- Image delivery insight
- Classic and modern keyboard navigation
- Ignore irrelevant scripts in the flame chart
- Timeline marker and range highlighting on hover
- Recommended throttling settings
- Timings markers in an overlay
- Stack traces of JS calls in Summary
- Badge settings moved to menu in Elements
- New 'What's new' panel
- Lighthouse 12.3.0
- Miscellaneous highlights
- Debug network requests, source files, and performance traces with Gemini
- View AI chat history
- Manage extension storage in Application > Storage
- Performance improvements
- Interaction phases in live metrics
- Render blocking information in the Summary tab
- Support for scheduler.postTask events and their initiator arrows
- Animations panel and Elements > Styles tab improvements
- Jump from Elements > Styles to Animations
- Real-time updates in Computed tab
- Compute pressure emulation in Sensors
- JS objects with the same name grouped by source in the Memory panel
- A new look for settings
- Performance insights panel is deprecated and removed from DevTools
- Miscellaneous highlights
- Debug CSS with Gemini
- Control AI features in a dedicated settings tab
- Performance panel improvements
- Annotate and share performance findings
- Get performance insights right in the Performance panel
- Spot excessive layout shifts easier
- Spot the non-composited animations
- Hardware concurrency moves to Sensors
- Ignore anonymous scripts and focus on your code in stack traces
- Elements > Styles: Support for sideways-* writing modes for grid overlays and CSS-wide keywords
- Lighthouse audits for non-HTTP pages in timespan and snapshot modes
- Accessibility improvements
- Miscellaneous highlights
- Network panel improvements
- Network filters reimagined
- HAR exports now exclude sensitive data by default
- Elements panel improvements
- Autocomplete values for text-emphasis-* properties
- Scroll overflows marked with a badge
- Performance panel improvements
- Recommendations in live metrics
- Navigate breadcrumbs
- Memory panel improvements
- New 'Detached elements' profile
- Improved naming of plain JS objects
- Turn off dynamic theming
- Chrome Experiment: Process sharing
- Lighthouse 12.2.1
- Miscellaneous highlights
- Recorder supports export to Puppeteer for Firefox
- Performance panel improvements
- Live metrics observations
- Search requests in the Network track
- See stack traces of performance.mark and performance.measure calls
- Use test address data in the Autofill panel
- Elements panel improvements
- Force more states for specific elements
- Elements > Styles now autocompletes more grid properties
- Lighthouse 12.2.0
- Miscellaneous highlights
- Console insights by Gemini are going live in most European countries
- Performance panel updates
- Enhanced Network track
- Customize performance data with extensibility API
- Details in the Timings track
- Copy all listed requests in the Network panel
- Faster heap snapshots with named HTML tags and less clutter
- Open Animations panel to capture animations and edit @keyframes live
- Lighthouse 12.1.0
- Accessibility improvements
- Miscellaneous highlights
- Inspect CSS anchor positioning in the Elements panel
- Sources panel improvements
- Enhanced 'Never Pause Here'
- New scroll snap event listeners
- Network panel improvements
- Updated network throttling presets
- Service worker information in custom fields of the HAR format
- Send and receive WebSocket events in the Performance panel
- Miscellaneous highlights
- Performance panel improvements
- Move and hide tracks with updated track configuration mode
- Ignore scripts in the flame chart
- Throttle down the CPU by 20 times
- Performance insights panel will be deprecated
- Find excessive memory usage with new filters in heap snapshots
- Inspect storage buckets in Application > Storage
- Disable self-XSS warnings with a command-line flag
- Lighthouse 12.0.0
- Miscellaneous highlights
- Understand errors and warnings in the Console better with Gemini
- @position-try rules support in Elements > Styles
- Sources panel improvements
- Configure automatic pretty-printing and bracket closing
- Handled rejected promises are recognized as caught
- Error causes in the Console
- Network panel improvements
- Inspect Early Hints headers
- Hide the Waterfall column
- Performance panel improvements
- Capture CSS selector statistics
- Change order and hide tracks
- Ignore retainers in the Memory panel
- Lighthouse 11.7.1
- Miscellaneous highlights
- New Autofill panel
- Enhanced network throttling for WebRTC
- Scroll-driven animations support in the Animations panel
- Improved CSS nesting support in Elements > Styles
- Enhanced Performance panel
- Hide functions and their children in the flame chart
- Arrows from selected initiators to events they initiated
- Lighthouse 11.6.0
- Tooltips for special categories in Memory > Heap snapshots
- Application > Storage updates
- Bytes used for shared storage
- Web SQL is fully deprecated
- Coverage panel improvements
- The Layers panel might be deprecated
- JavaScript Profiler deprecation: Phase four, final
- Miscellaneous highlights
- Find the Easter egg
- Elements panel updates
- Emulate a focused page in Elements > Styles
- Color Picker, Angle Clock, and Easing Editor in
var()fallbacks - CSS length tool is deprecated
- Popover for the selected search result in the Performance > Main track
- Network panel updates
- Clear button and search filter in the Network > EventStream tab
- Tooltips with exemption reasons for third-party cookies in Network > Cookies
- Enable and disable all breakpoints in Sources
- View loaded scripts in DevTools for Node.js
- Lighthouse 11.5.0
- Accessibility improvements
- Miscellaneous highlights
- The official collection of Recorder extensions is live
- Network improvements
- Failure reason in the Status column
- Improved Copy submenu
- Performance improvements
- Breadcrumbs in the Timeline
- Event initiators in the Main track
- JavaScript VM instance selector menu for Node.js DevTools
- New shortcut and command in Sources
- Elements improvements
- The ::view-transition pseudo-element is now editable in Styles
- The align-content property support for block containers
- Posture support for emulated foldable devices
- Dynamic theming
- Third-party cookies phaseout warnings in the Network and Application panels
- Lighthouse 11.4.0
- Accessibility improvements
- Miscellaneous highlights
- Elements improvements
- Streamlined filter bar in the Network panel
@font-palette-valuessupport- Supported case: Custom property as a fallback of another custom property
- Improved source map support
- Performance panel improvements
- Enhanced Interactions track
- Advanced filtering in Bottom-Up, Call Tree, and Event Log tabs
- Indentation markers in the Sources panel
- Helpful tooltips for overridden headers and content in the Network panel
- New Command Menu options for adding and removing request blocking patterns
- The CSP violations experiment is removed
- Lighthouse 11.3.0
- Accessibility improvements
- Miscellaneous highlights
- Third-party cookie phaseout
- Analyze your website's cookies with the Privacy Sandbox Analysis Tool
- Enhanced ignore listing
- Default exclusion pattern for node_modules
- Caught exceptions now stop execution if caught or passing through non-ignored code
x_google_ignoreListrenamed toignoreListin source maps- New input mode toggle during remote debugging
- The Elements panel now shows URLs for #document nodes
- Effective Content Security Policy in the Application panel
- Improved animation debugging
- 'Do you trust this code?' dialog in Sources and self-XSS warning in Console
- Event listener breakpoints in web workers and worklets
- The new media badge for
<audio>and<video> - Preloading renamed to Speculative loading
- Lighthouse 11.2.0
- Accessibility improvements
- Miscellaneous highlights
- Improved @property section in Elements > Styles
- Editable @property rule
- Issues with invalid @property rules are reported
- Updated list of devices to emulate
- Pretty-print inline JSON in script tags in Sources
- Autocomplete private fields in Console
- Lighthouse 11.1.0
- Accessibility improvements
- Web SQL deprecation
- Screenshot aspect ratio validation in Application > Manifest
- Miscellaneous highlights
- New section for custom properties in Elements > Styles
- More local overrides improvements