
Network panel improvements
This version brings an number of improvements to the Network panel.
Network filters reimagined
The Network panel gets new filters, reimagined based on your feedback. The type-specific filters stay the same — a set of badges in a clean multi-select bar.
To declutter the UI, hide-, block-, and third-party-related checkboxes move under a drop-down list. The list has a number that tells you how many filters are checked under the drop-down.
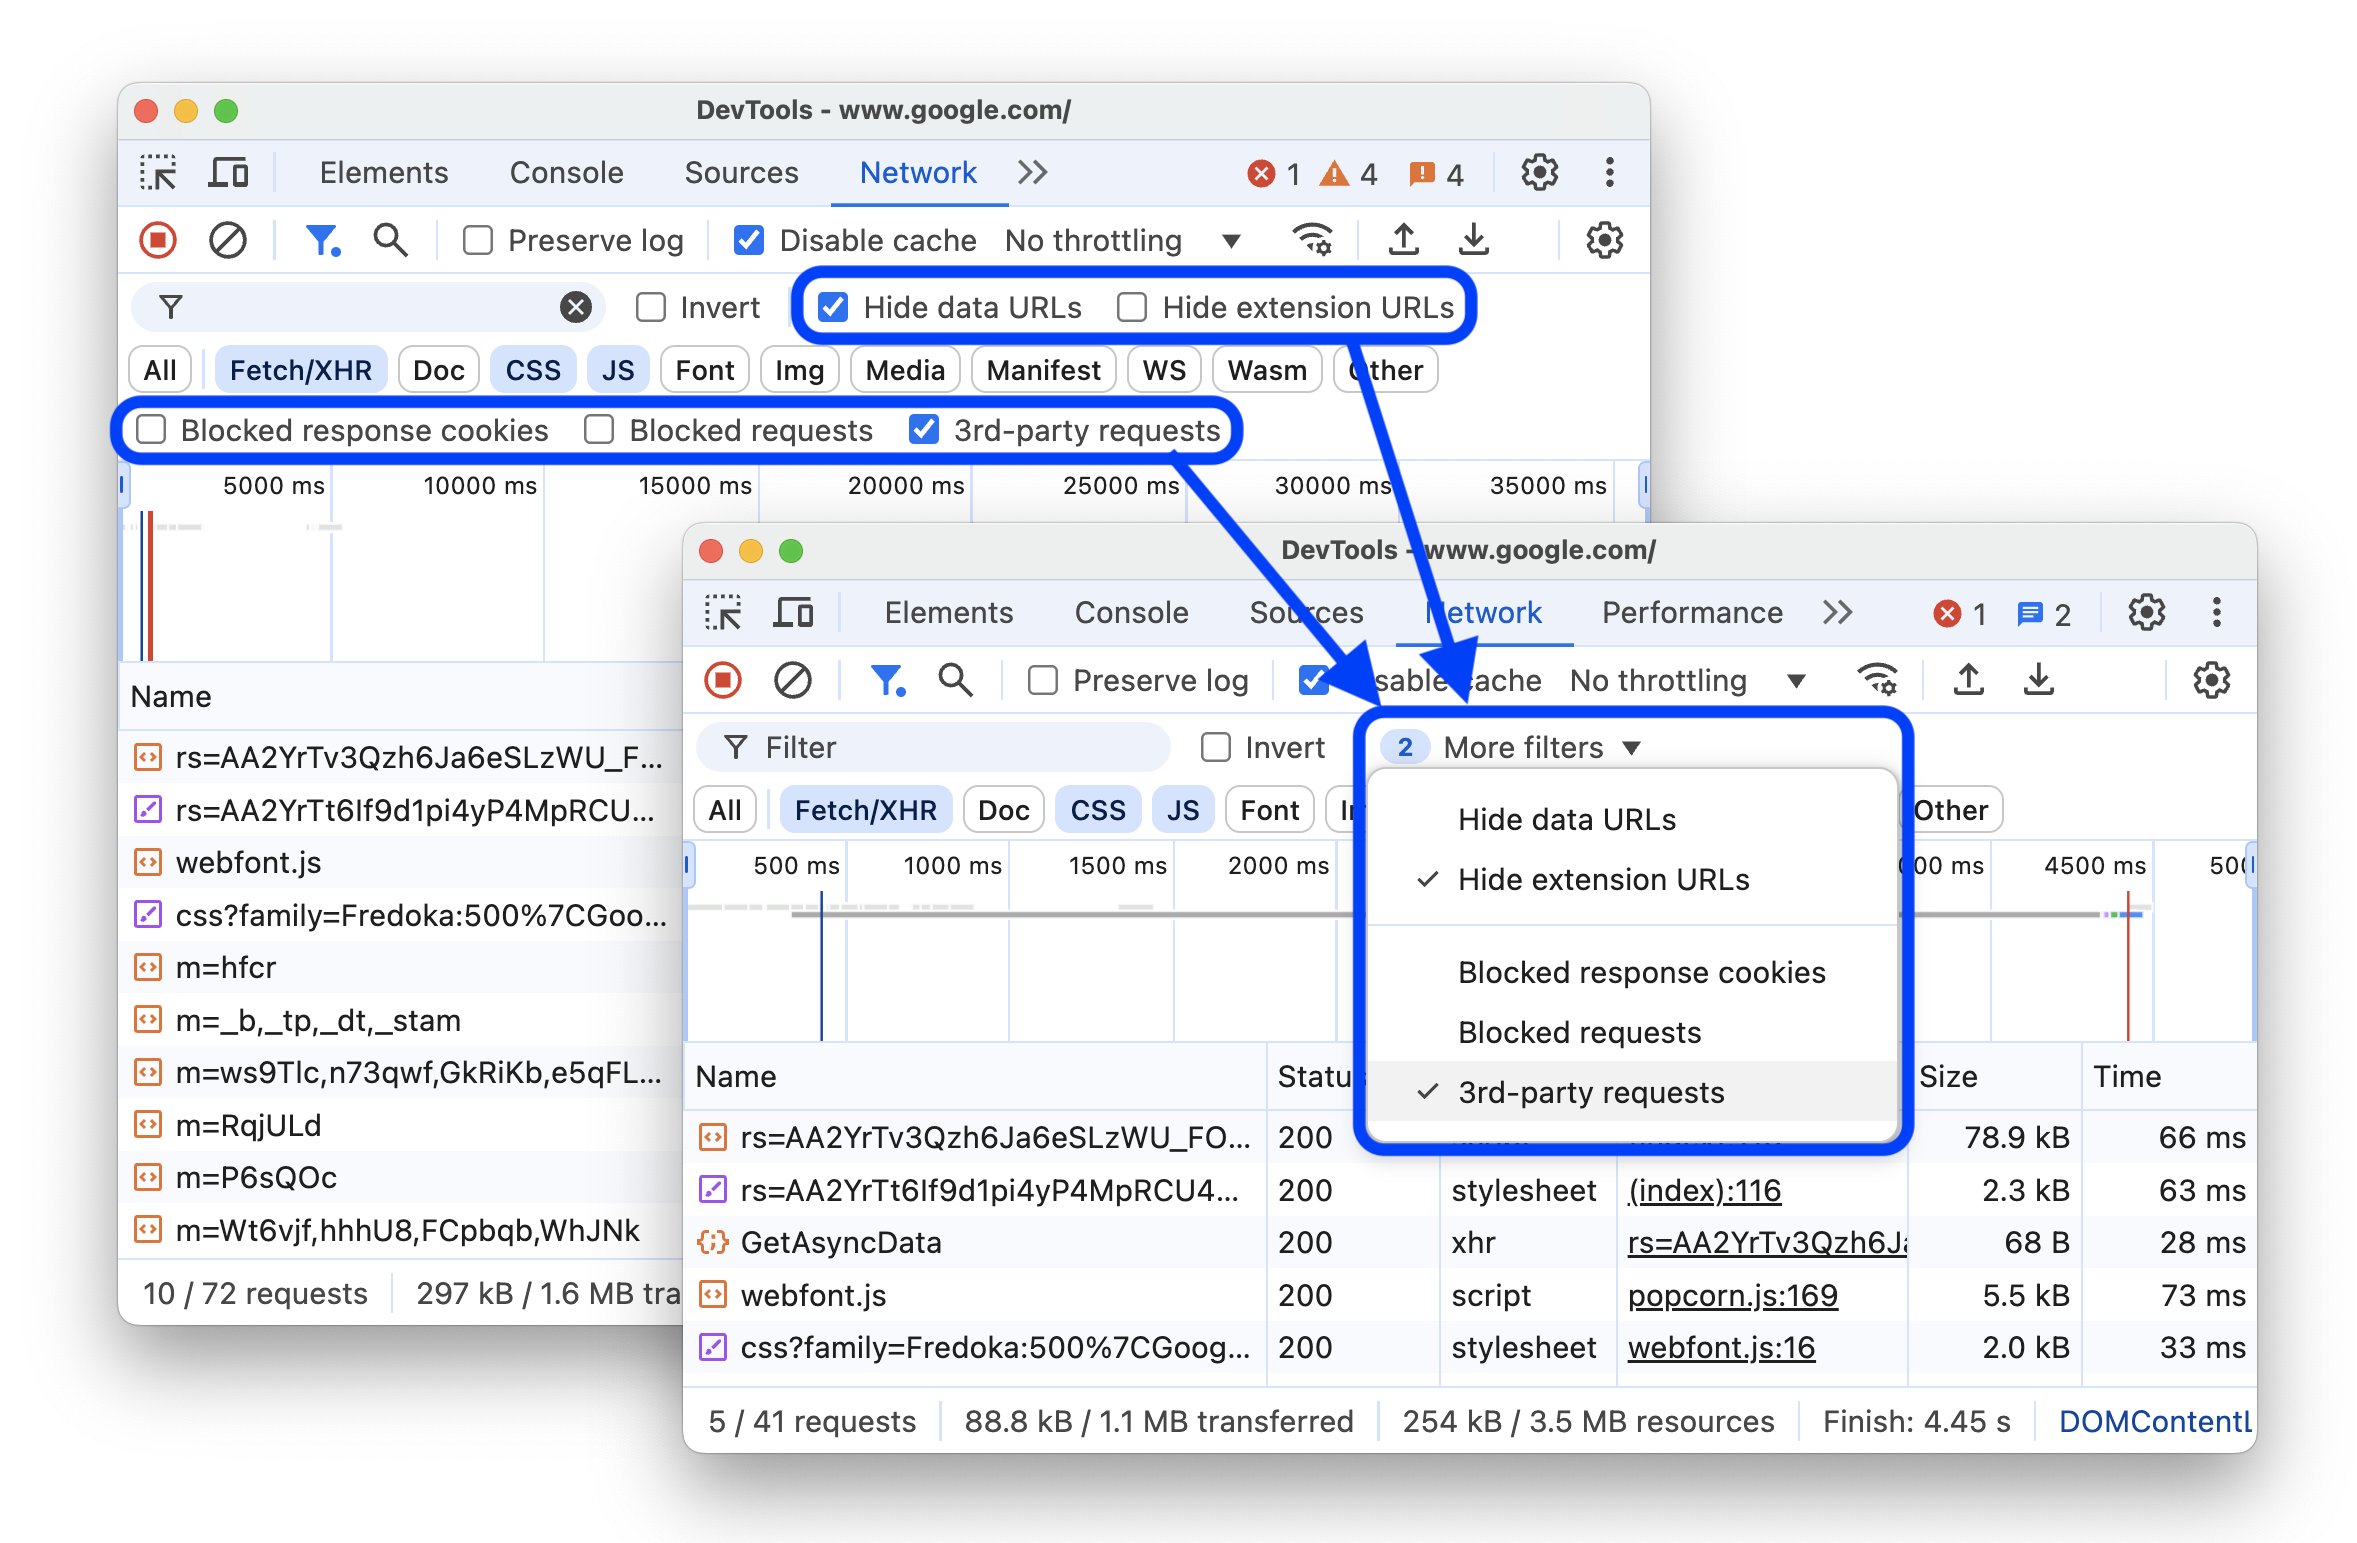
To bring back the old filter design, clear Settings > Experiments > Redesign of the filter bar in the Network panel.
Let us know what you think about the reimagined design.
Chromium issue: 362672528.
HAR exports now exclude sensitive data by default
To reduce the chances of accidental leaks of sensitive information, the network log exported in HAR format will no longer contain Cookie, Set-Cookie, and Authorization headers by default.
To export logs in HAR format with the sensitive data, turn on Settings > Preferences > Network > Allow to generate HAR with sensitive data. The Network panel will mark the Export button with an arrow. Long-click the button and select Export HAR (with sensitive data) from the drop-down menu.

Chromium issue: 361717594.
Elements panel improvements
This version brings an number of improvements to the Elements panel.
Autocomplete values for text-emphasis-* properties
Autocomplete in the Styles tab now suggests values for the following CSS properties:
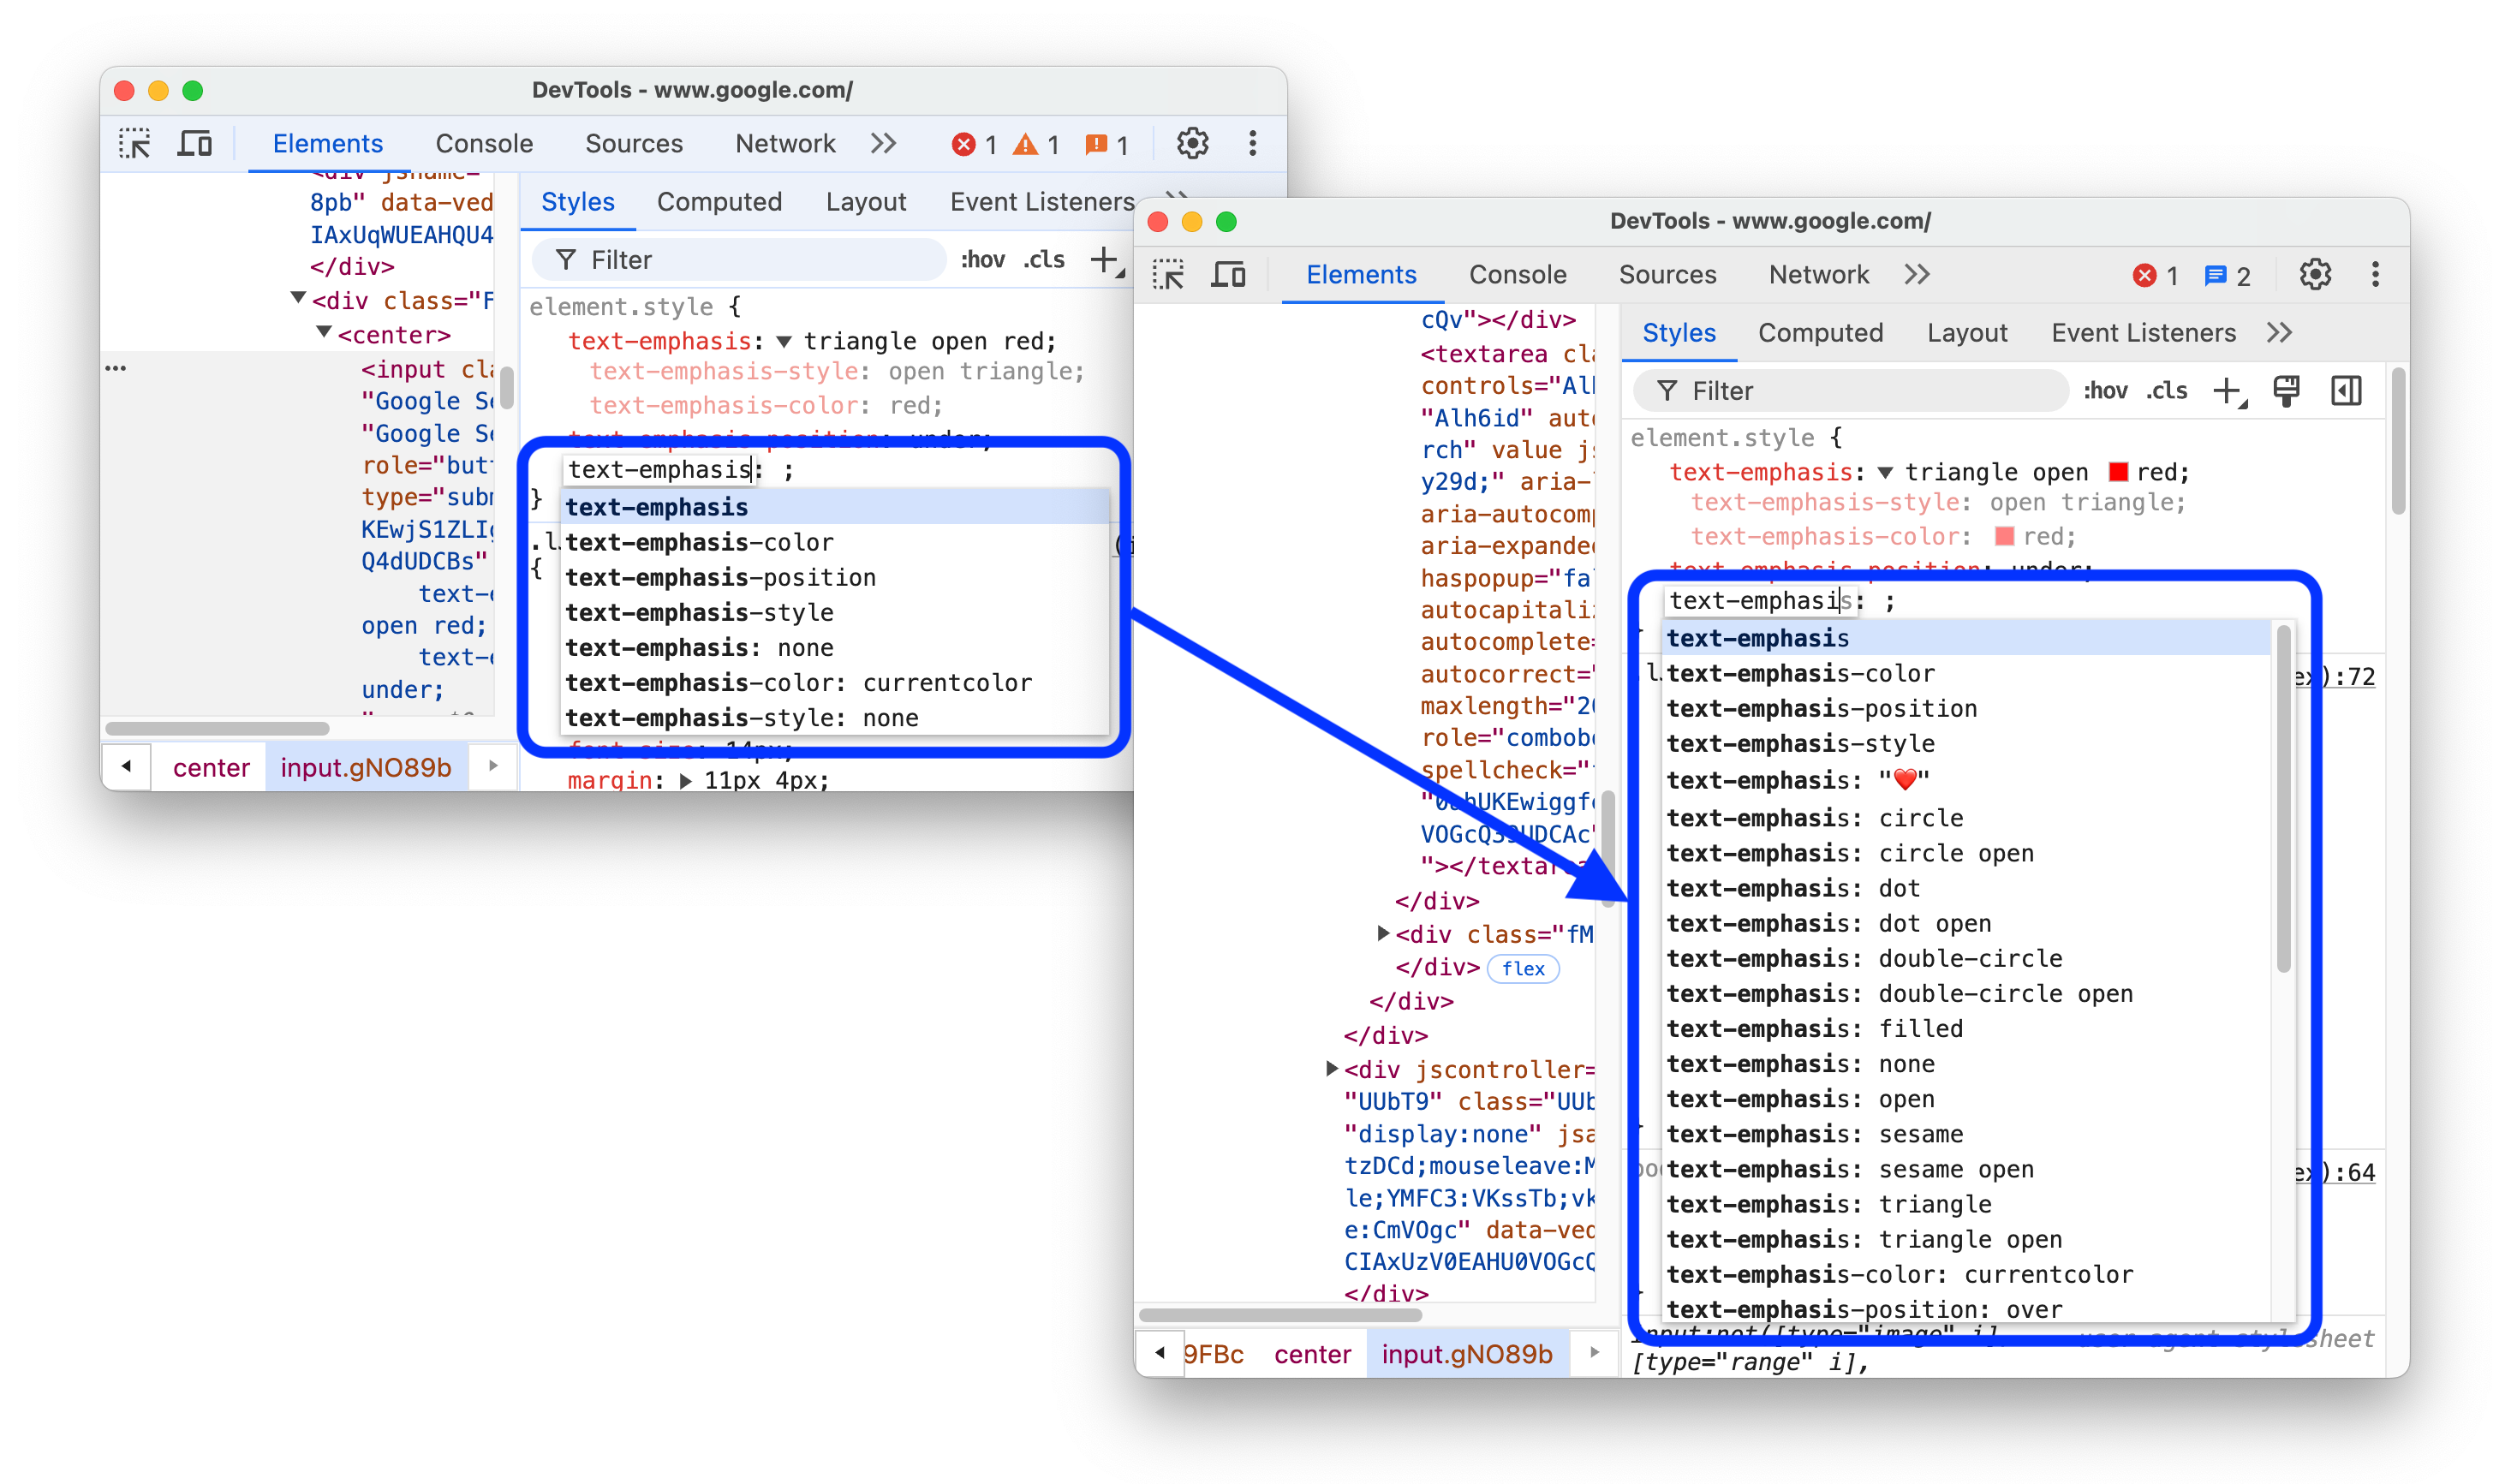
Chromium issue: 361471205.
Scroll overflows marked with a badge
The Elements panel now marks with a new 'scroll' badge the elements that contain overflowing content and have overflow: scroll or overflow: auto, so you can easily spot scroll overflows. Like the other badges, this badge reflects the current DOM and disappears if the content stops overflowing due to, for example, a size change.
Chromium issue: 40670442.
Bare declarations after nested rules don't "shift up"
Following the CSS Working Group's decision to allow for bare declarations to come after nested rules, the Styles tab now doesn't "shift up" these declarations during parsing.
In the following code sample, the bare declaration after the nested rule now doesn't cause Chrome to unexpectedly reorder the styles in the cascade:
p {
  width: 100px;
  height: 100px;
  @media screen {
    background-color: red;
  }

  background-color: green;
}
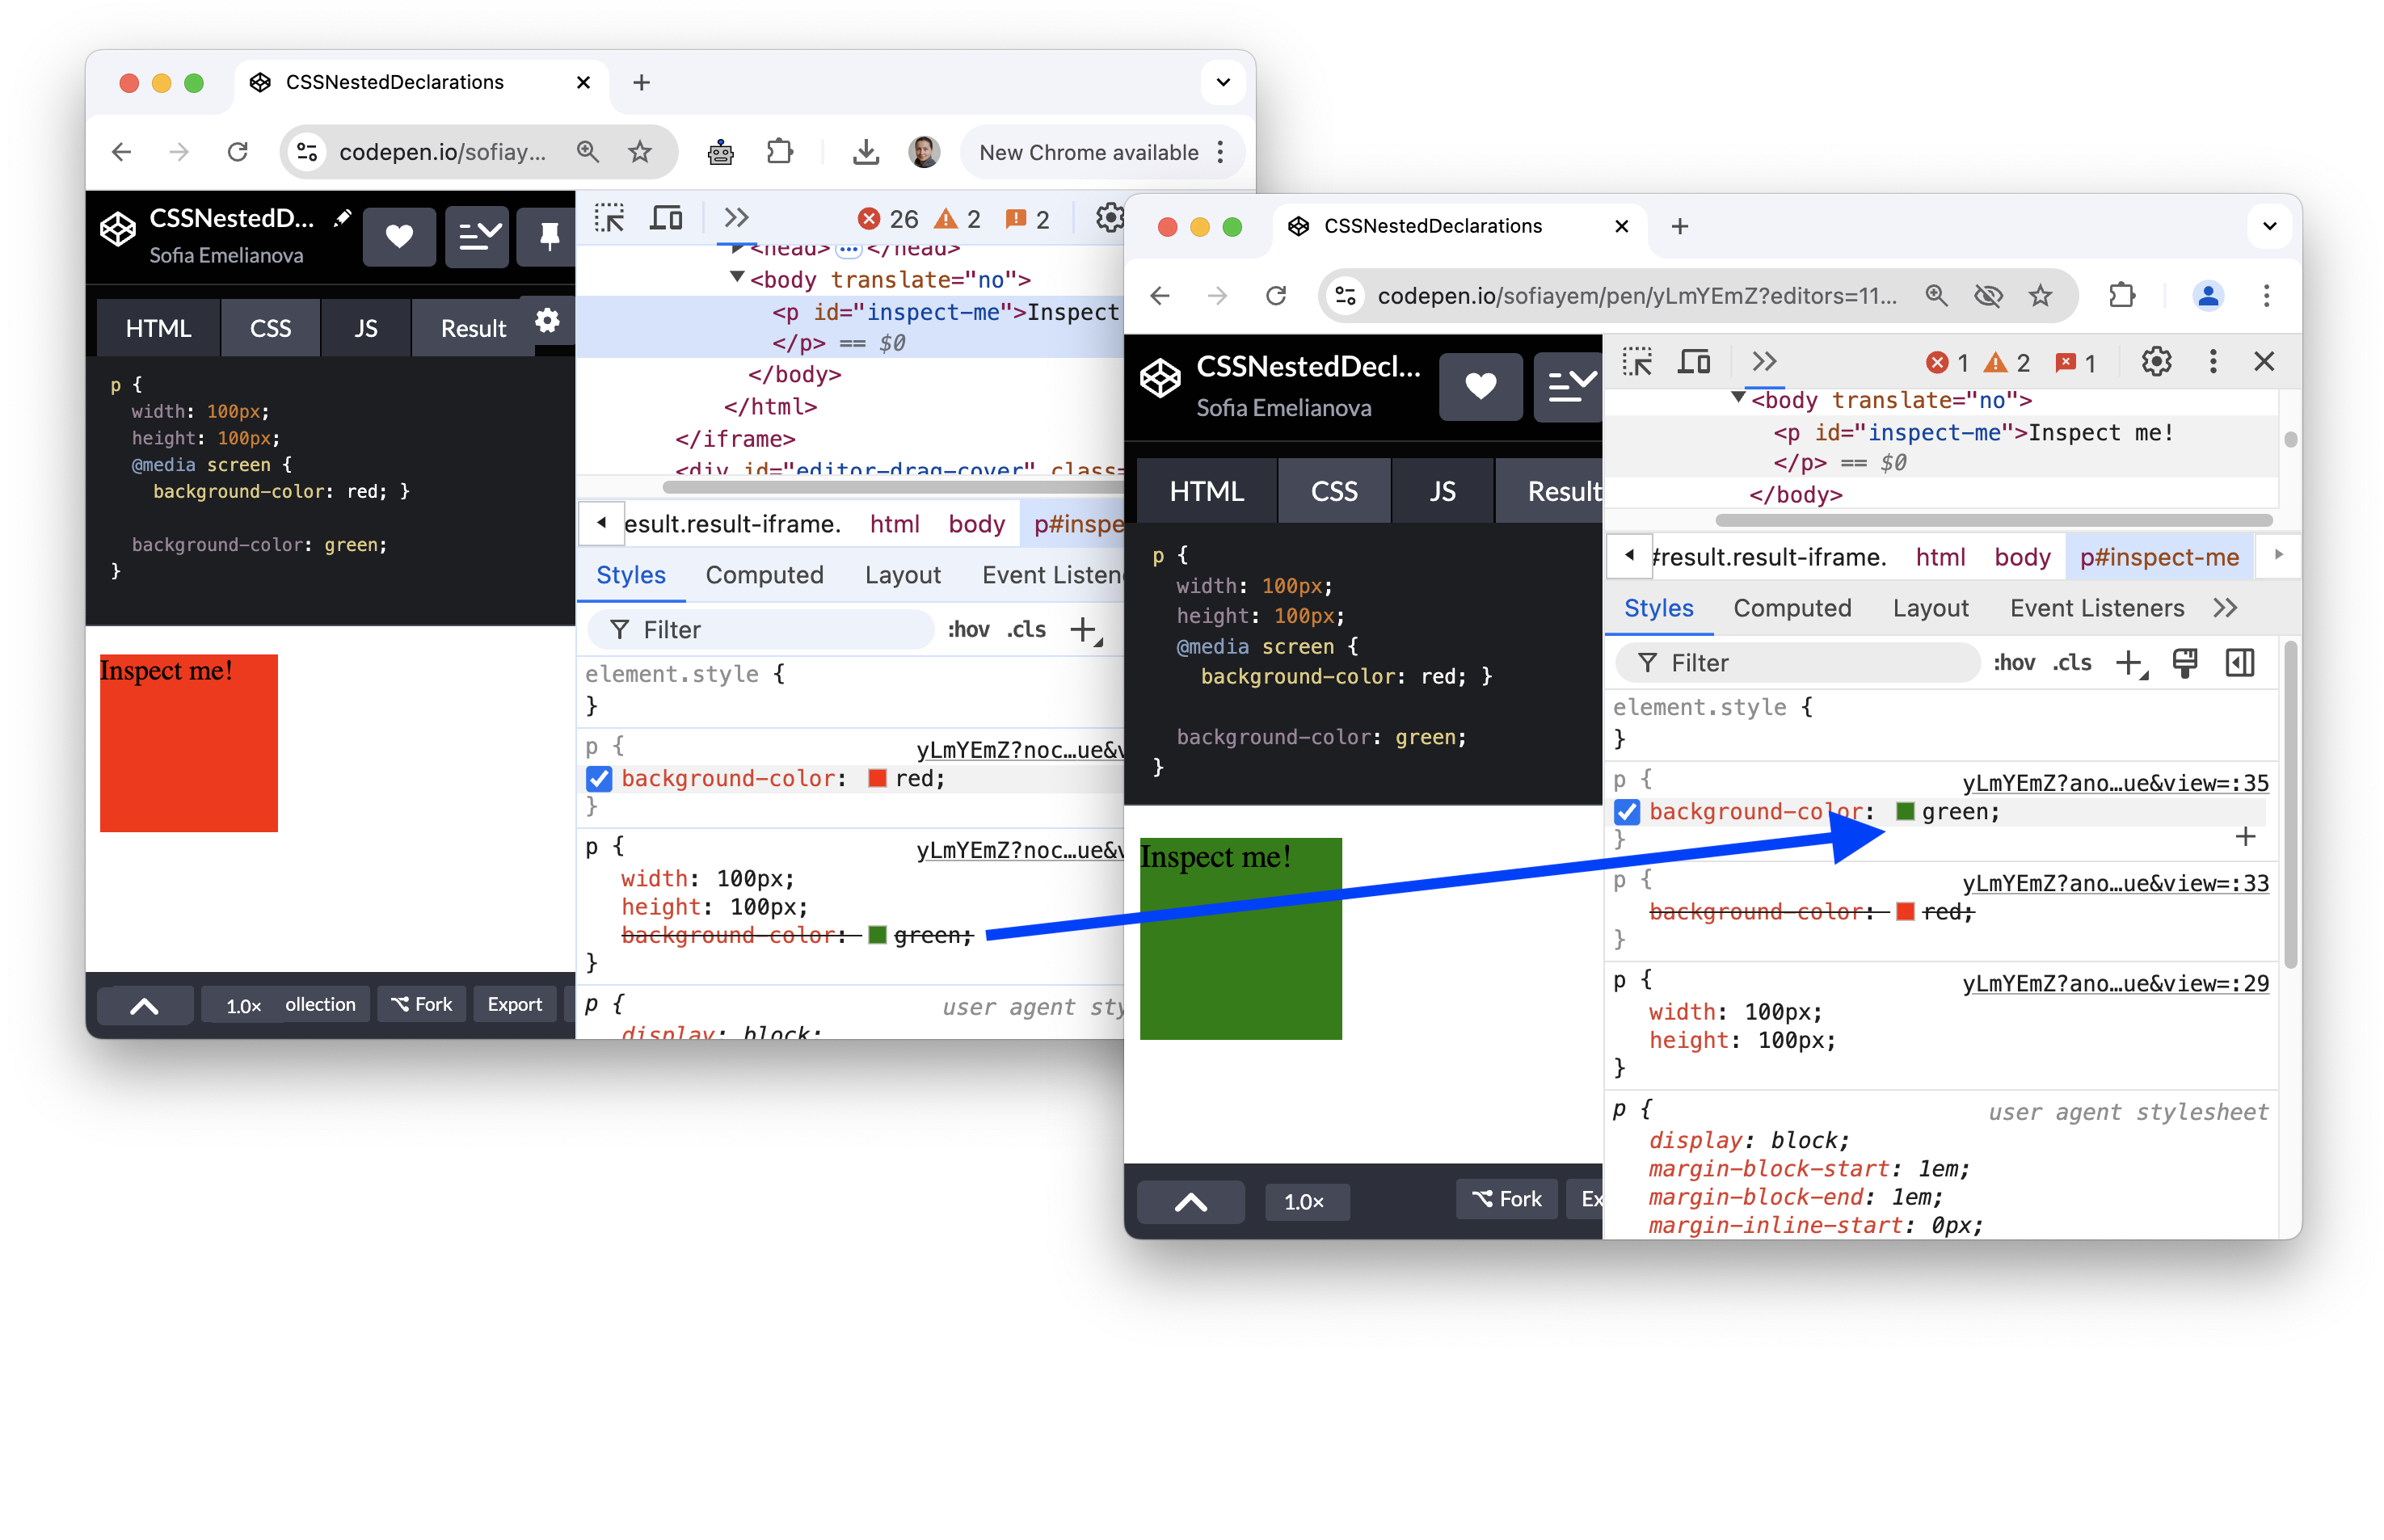
Chromium issue: 358119261.
Performance panel improvements
This version brings an number of improvements to the Performance panel.
Recommendations in live metrics
Live metrics can now provide metric-specific recommendations that help you configure your development environment as close as possible to what your users experience.
To get recommendations, set up field data fetching from Chrome UX Report (CrUX) and expand the Consider your local test conditions section in each metric card (if any) and Consider real user environments in the Environment settings.
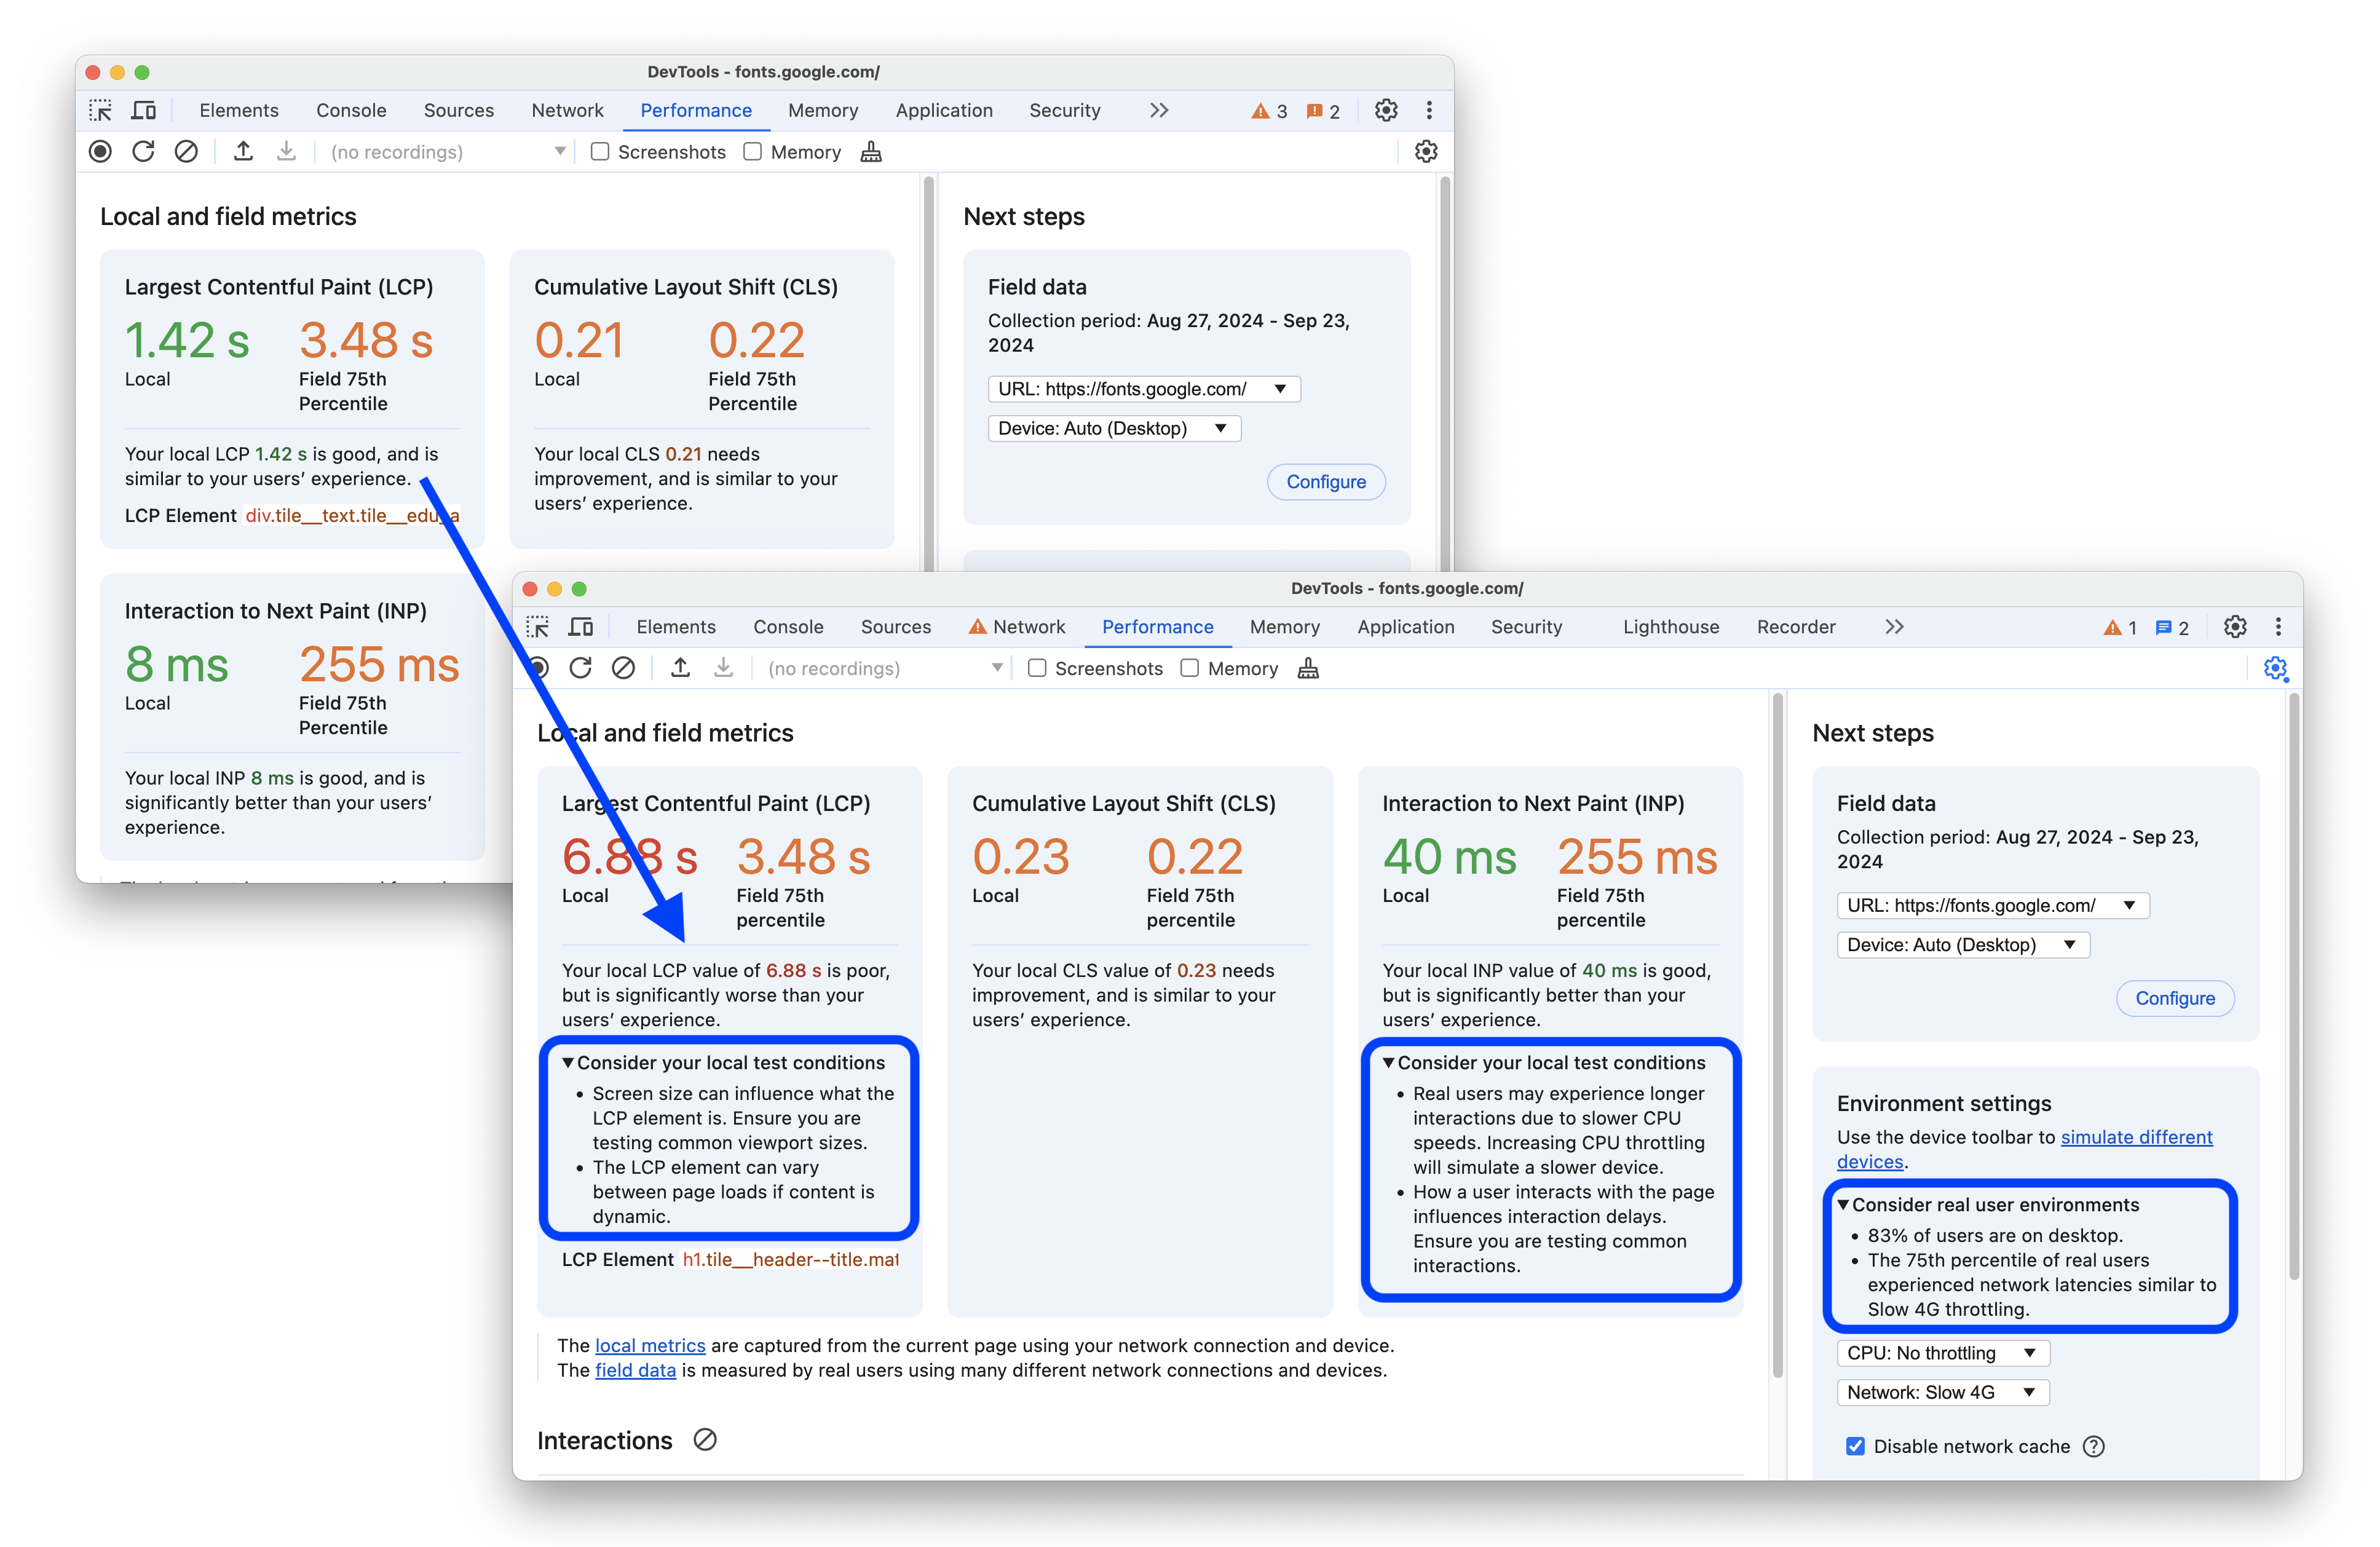
Follow the recommendations to approximate the experience of your users.
Navigate breadcrumbs
You can now navigate breadcrumbs in the timeline of a performance recording: "jump" back and forth between breadcrumbs, overwrite a child breadcrumbs, and remove multiple childs. Previously, when you selected a parent breadcrumb, its children would disappear.
Memory panel improvements
This version brings an number of improvements to the Memory panel.
New 'Detached elements' profile
The Memory panel gets a new profile type—Detached elements. It shows objects that are retained by a JavaScript reference.
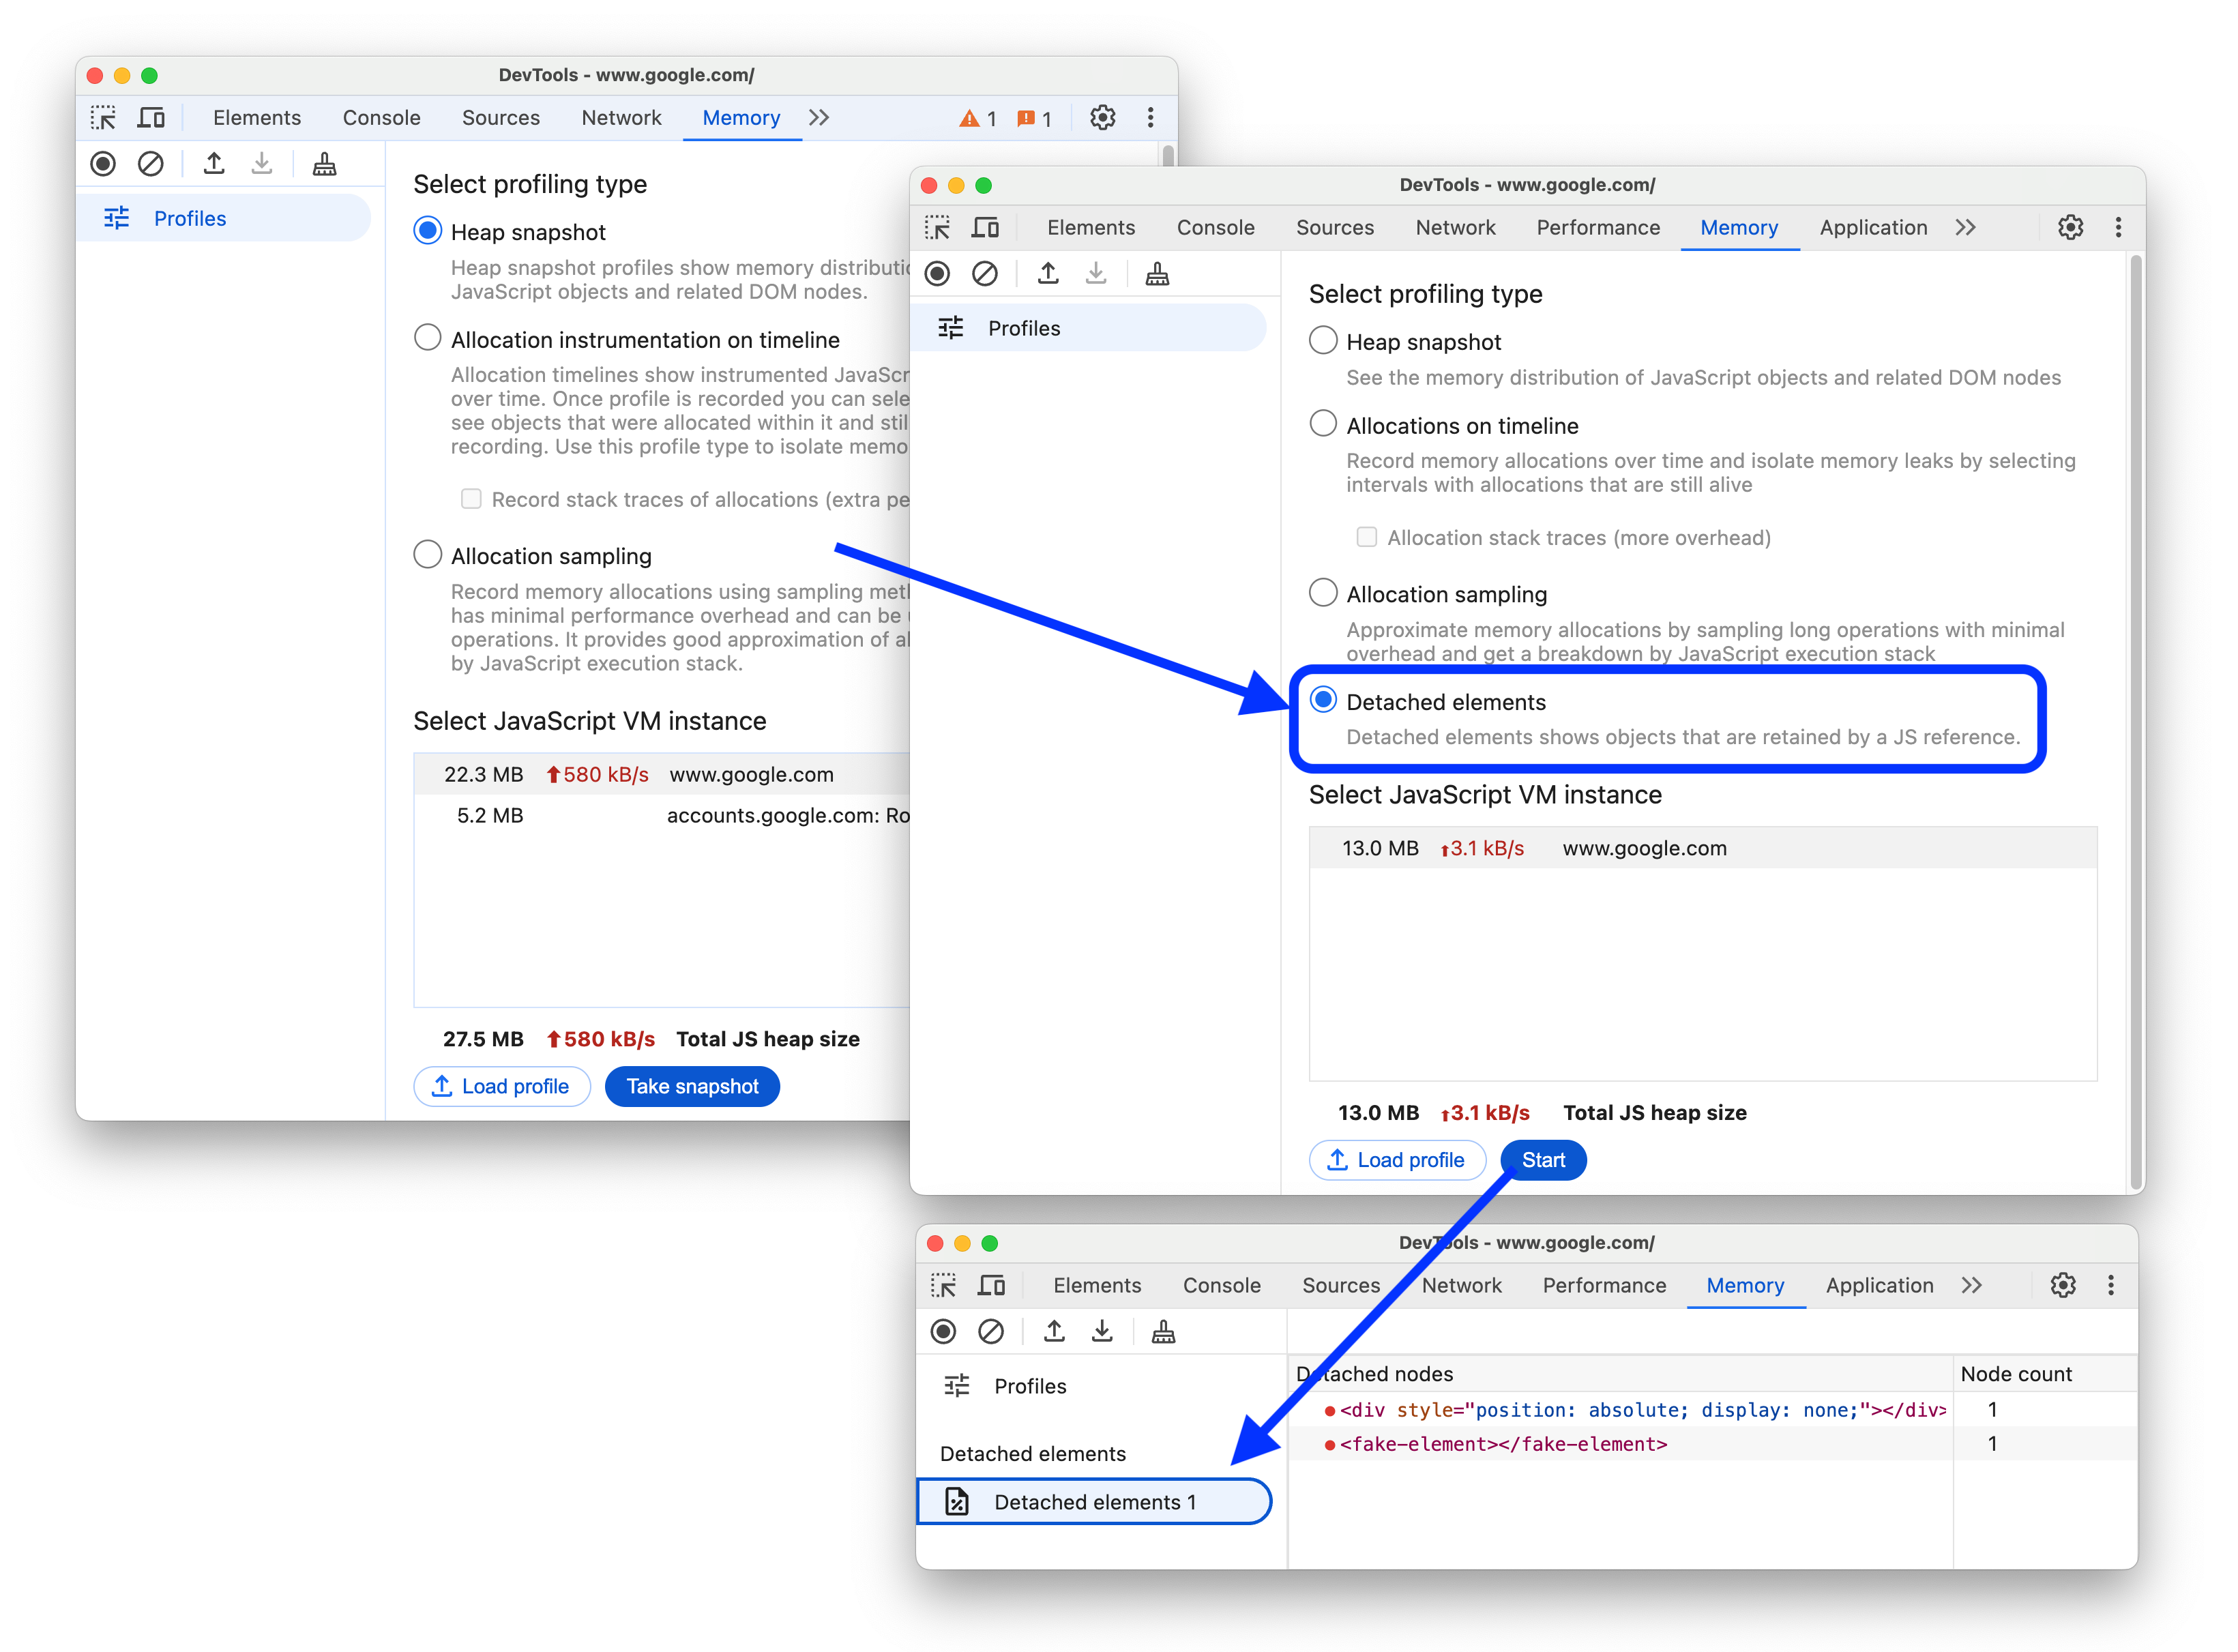
Chromium issue: 350519222.
Improved naming of plain JS objects
To organize and declutter the Object category in heap snapshots, plain JavaScript objects are now:
- Named based on the properties they contain, for example,
{firstProperty, secondProperty, ..., *nthProperty}. - Searchable by these names that are constructed by DevTools.
- Grouped together if they have the same properties.
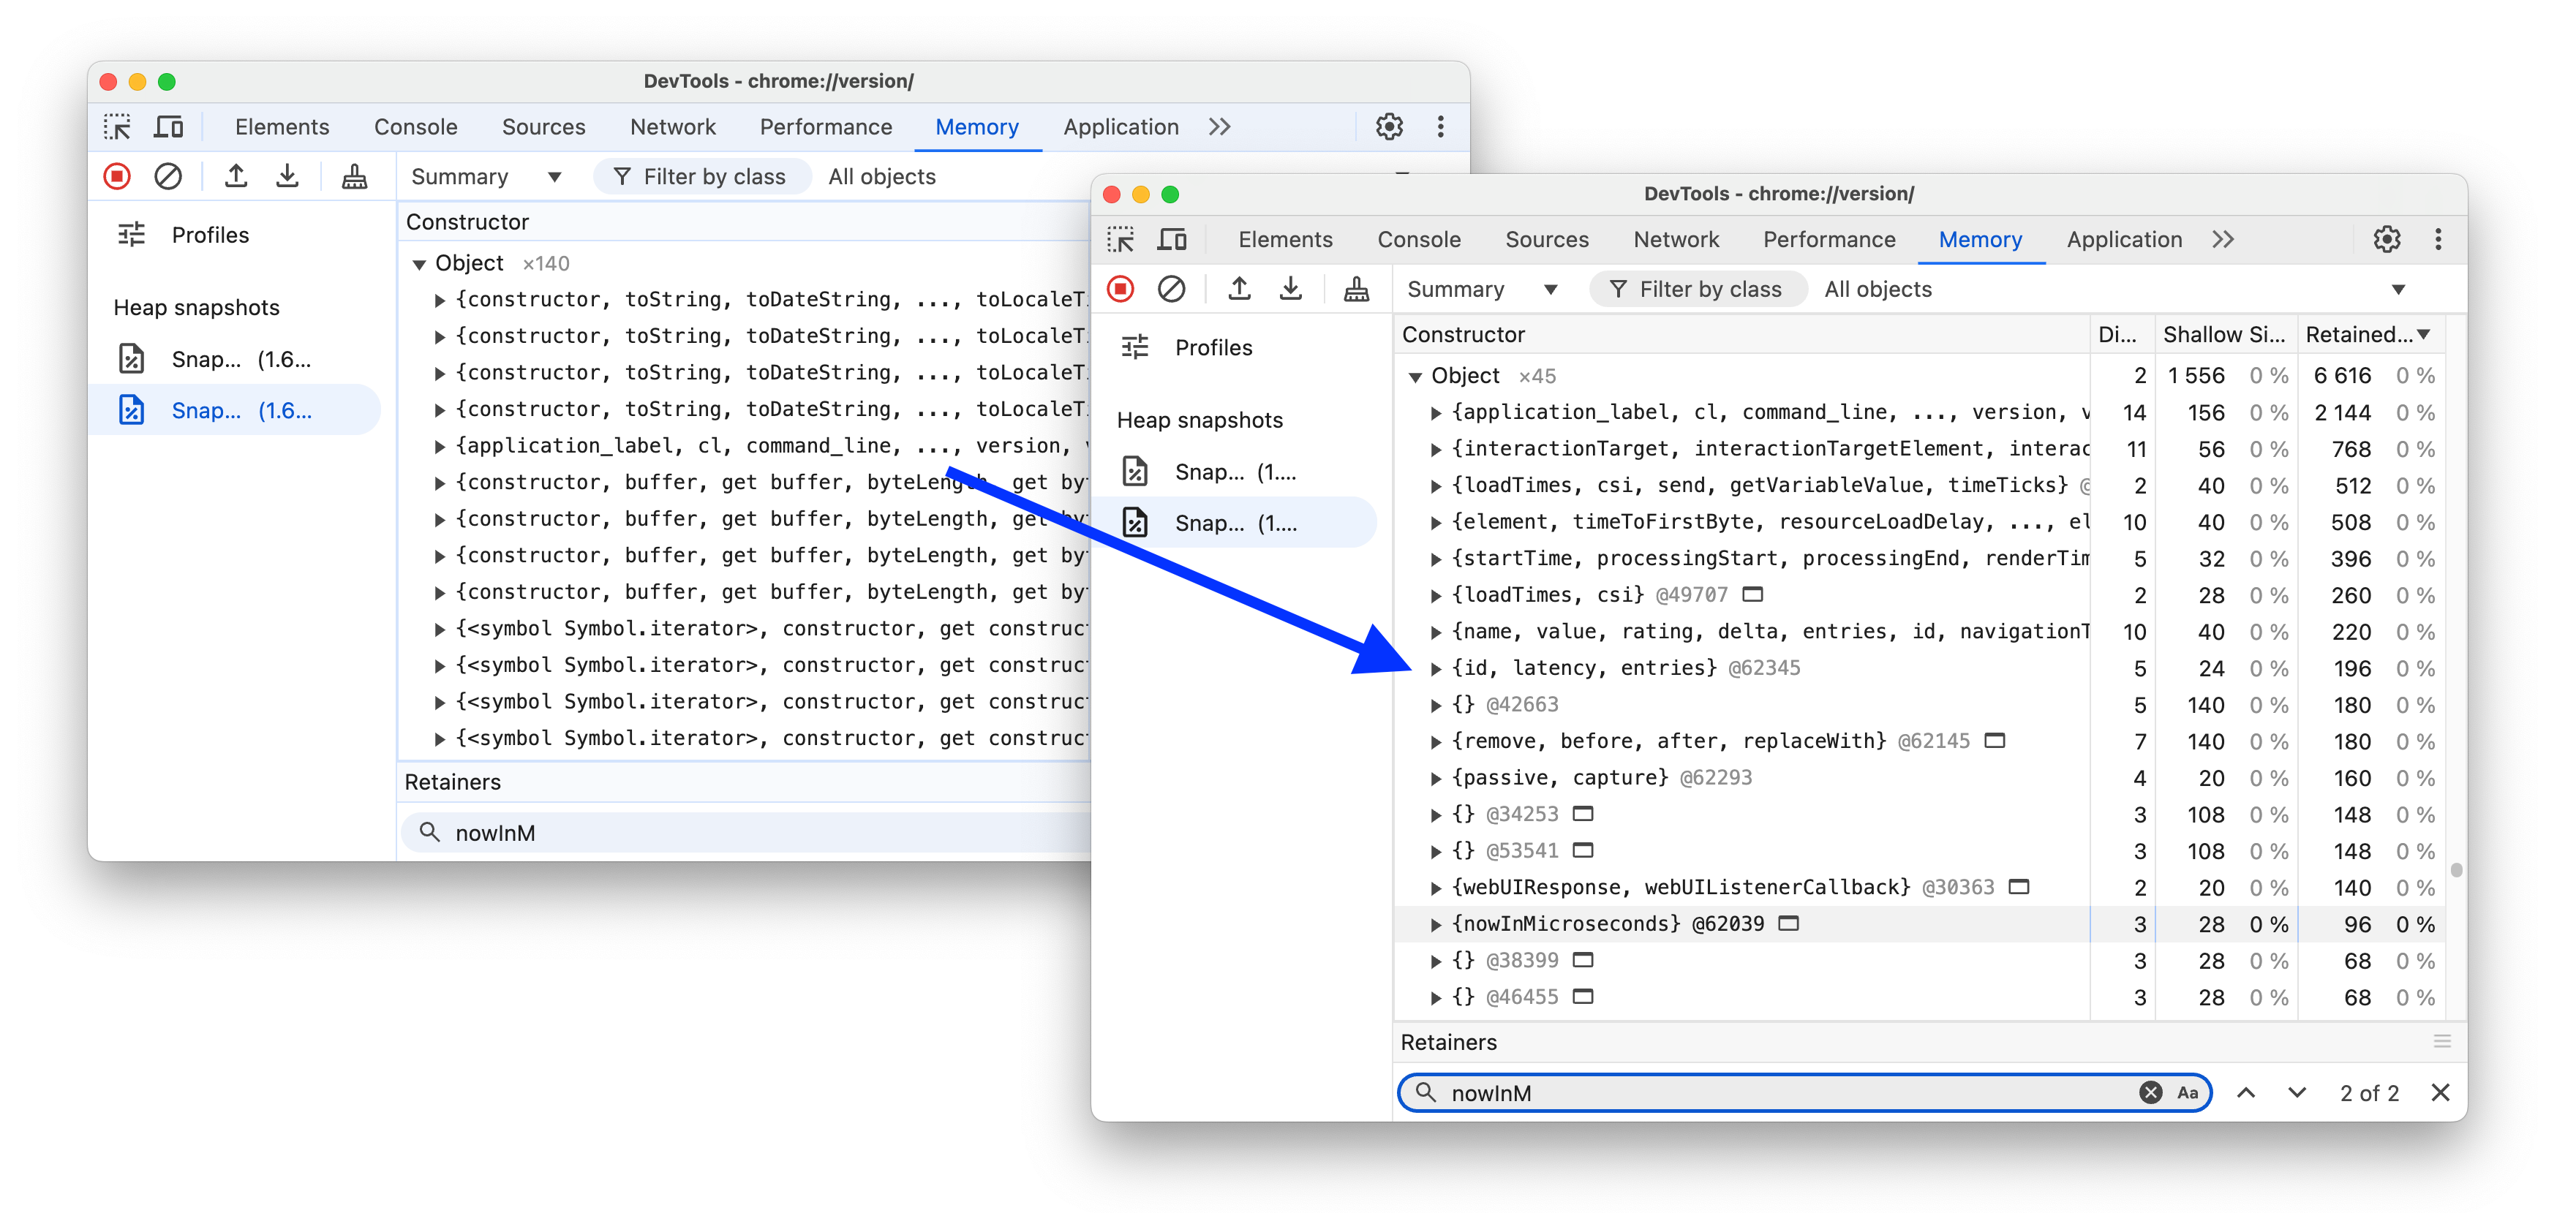
Chromium issue: 350519222.
Turn off dynamic theming
You can now turn off the automatic matching of DevTools colors to your custom theme colors in Chrome.
To turn off dynamic theming, clear Settings > Preferences > Appearance > Match Chrome color scheme and reload DevTools.

Chromium issue: 328472696.
Chrome Experiment: Process sharing
Normally, when you open multiple tabs from the same website (like Google Docs), Chrome creates a separate renderer process for each. The Process sharing experiment changes this by allowing multiple tabs to share the same renderer process to improve performance.
If you see a message stating "This tab shares resources with other tabs..." infobar while DevTools is open, then you are part of the small group with the Process sharing experiment enabled.

Process sharing can affect breakpoint debugging and performance analysis. For more information, see Chrome Experiment: Process sharing.
Lighthouse 12.2.1
The Lighthouse panel now runs Lighthouse 12.2.1.
This update introduces a < 20 KB ignore threshold for resource compression suggestions to help you focus only on the meaningful file size savings. See the full list of changes.
To learn the basics of using the Lighthouse panel in DevTools, see Lighthouse: Optimize website speed.
Chromium issue: 772558.
Miscellaneous highlights
These are some noteworthy fixes and improvements in this release:
- Elements:
- Console: Fixed a non-escaped ampersand in multi-line strings in cURL commands (352651673).
- Memory: Fixed the default selection on pages with service workers, main thread now selected (40669896).
- Security: The URL scheme highlighting now correctly updates as the security stage of an origin changes (359920086).
Download the preview channels
Consider using the Chrome Canary, Dev, or Beta as your default development browser. These preview channels give you access to the latest DevTools features, let you test cutting-edge web platform APIs, and help you find issues on your site before your users do!
Get in touch with the Chrome DevTools team
Use the following options to discuss the new features, updates, or anything else related to DevTools.
- Submit feedback and feature requests to us at crbug.com.
- Report a DevTools issue using the More options > Help > Report a DevTools issue in DevTools.
- Tweet at @ChromeDevTools.
- Leave comments on What's new in DevTools YouTube videos or DevTools Tips YouTube videos.
What's new in DevTools
A list of everything that has been covered in the What's new in DevTools series.
- DevTools MCP server updates
- Improved trace sharing
- Support for @starting-style
- Editor widget for display: masonry
- Lighthouse 13
- Code suggestions from Gemini
- Enhancements for the DevTools MCP server
- Quicker access to AI assistance
- Debug the full performance trace with Gemini
- Toggle drawer orientation
- Google Developer Program
- Miscellaneous highlights
- Chrome DevTools (MCP) for your AI agent
- Debug the network dependency tree with Gemini
- Export your chats with Gemini
- Persisted track configuration in the Performance panel
- Filter IP protected network requests
- Elements > Layout tab adds masonry layout support
- Lighthouse 12.8.2
- Miscellaneous highlights
- Debug more insights with Gemini
- Emulate the 'Save-Data' header in 'Network conditions'
- See the Baseline status in a CSS property tooltip
- Override form factors in user agent client hints
- Lighthouse 12.8.0
- Miscellaneous highlights
- A more reliable and productive Chrome DevTools
- Upload images in AI assistance for styling
- Add request headers to the table in Network
- Check out the highlights from Google I/O 2025
- Miscellaneous highlights
- Performance panel improvements
- Preconnected origins in 'Network dependency tree' insight
- Server response and redirection times in 'Document request latency' insight
- Redirects in Summary of network requests
- Reduced noise in the performance trace
- Deprecated 'Disable JavaScript samples'
- Geolocation accuracy parameter in Sensors
- Elements panel improvements
- Debug complex CSS values easier
- @function support in Elements > Styles
- Network panel improvements
- has-request-header filter
- Direct Sockets in Isolated Web Apps
- Miscellaneous highlights
- Accessibility
- Google I/O 2025 edition
- Modify and save CSS changes to your workspace with Gemini
- Connect a workspace folder and save changes back to your source files
- Ask Gemini about performance insights
- Annotate performance findings with Gemini
- Add screenshots to your chats with Gemini
- New insights in the Performance panel
- Duplicated JavaScript
- Legacy JavaScript
- Speculations now support rule tags
- Lighthouse 12.6.0
- Miscellaneous highlights
- Accessibility
- Performance panel improvements
- New performance insights
- Click to highlight
- Server timings in Summary of network requests
- Filter cookies in 'Privacy and security'
- Sizes in kB units in tables across panels
- Autocomplete supports corner-shape and corner-*-shape in Elements > Styles
- Experimental: Highlighting issues with elements and attributes in DOM
- Lighthouse 12.5.0
- Miscellaneous highlights
- Performance panel improvements
- Origin and script links for profile and function calls in Performance
- LCP by phase field data support
- Network dependency tree insight
- Duration instead of total and self time in Summary
- Heaviest stack highlighting
- Improved empty states for various panels
- Accessibility tree view in Elements
- Lighthouse 12.4.0
- Miscellaneous highlights
- Privacy and security panel
- Performance panel improvements
- Calibrated CPU throttling presets
- Select different performance events in the same AI chat
- First- and third-party highlighting in Performance
- Field data in marker tooltips and insights
- Forced reflow insight
- 'Optimize DOM size' insight
- Extend the performance trace with console.timeStamp
- Elements panel improvements
- Real-time values of animated styles
- Support for :open pseudo-class and various pseudo-elements
- Copy all console messages
- Byte units in the Memory panel
- Miscellaneous highlights
- Persistent AI chat history
- Performance panel improvements
- Image delivery insight
- Classic and modern keyboard navigation
- Ignore irrelevant scripts in the flame chart
- Timeline marker and range highlighting on hover
- Recommended throttling settings
- Timings markers in an overlay
- Stack traces of JS calls in Summary
- Badge settings moved to menu in Elements
- New 'What's new' panel
- Lighthouse 12.3.0
- Miscellaneous highlights
- Debug network requests, source files, and performance traces with Gemini
- View AI chat history
- Manage extension storage in Application > Storage
- Performance improvements
- Interaction phases in live metrics
- Render blocking information in the Summary tab
- Support for scheduler.postTask events and their initiator arrows
- Animations panel and Elements > Styles tab improvements
- Jump from Elements > Styles to Animations
- Real-time updates in Computed tab
- Compute pressure emulation in Sensors
- JS objects with the same name grouped by source in the Memory panel
- A new look for settings
- Performance insights panel is deprecated and removed from DevTools
- Miscellaneous highlights
- Debug CSS with Gemini
- Control AI features in a dedicated settings tab
- Performance panel improvements
- Annotate and share performance findings
- Get performance insights right in the Performance panel
- Spot excessive layout shifts easier
- Spot the non-composited animations
- Hardware concurrency moves to Sensors
- Ignore anonymous scripts and focus on your code in stack traces
- Elements > Styles: Support for sideways-* writing modes for grid overlays and CSS-wide keywords
- Lighthouse audits for non-HTTP pages in timespan and snapshot modes
- Accessibility improvements
- Miscellaneous highlights
- Network panel improvements
- Network filters reimagined
- HAR exports now exclude sensitive data by default
- Elements panel improvements
- Autocomplete values for text-emphasis-* properties
- Scroll overflows marked with a badge
- Performance panel improvements
- Recommendations in live metrics
- Navigate breadcrumbs
- Memory panel improvements
- New 'Detached elements' profile
- Improved naming of plain JS objects
- Turn off dynamic theming
- Chrome Experiment: Process sharing
- Lighthouse 12.2.1
- Miscellaneous highlights
- Recorder supports export to Puppeteer for Firefox
- Performance panel improvements
- Live metrics observations
- Search requests in the Network track
- See stack traces of performance.mark and performance.measure calls
- Use test address data in the Autofill panel
- Elements panel improvements
- Force more states for specific elements
- Elements > Styles now autocompletes more grid properties
- Lighthouse 12.2.0
- Miscellaneous highlights
- Console insights by Gemini are going live in most European countries
- Performance panel updates
- Enhanced Network track
- Customize performance data with extensibility API
- Details in the Timings track
- Copy all listed requests in the Network panel
- Faster heap snapshots with named HTML tags and less clutter
- Open Animations panel to capture animations and edit @keyframes live
- Lighthouse 12.1.0
- Accessibility improvements
- Miscellaneous highlights
- Inspect CSS anchor positioning in the Elements panel
- Sources panel improvements
- Enhanced 'Never Pause Here'
- New scroll snap event listeners
- Network panel improvements
- Updated network throttling presets
- Service worker information in custom fields of the HAR format
- Send and receive WebSocket events in the Performance panel
- Miscellaneous highlights
- Performance panel improvements
- Move and hide tracks with updated track configuration mode
- Ignore scripts in the flame chart
- Throttle down the CPU by 20 times
- Performance insights panel will be deprecated
- Find excessive memory usage with new filters in heap snapshots
- Inspect storage buckets in Application > Storage
- Disable self-XSS warnings with a command-line flag
- Lighthouse 12.0.0
- Miscellaneous highlights
- Understand errors and warnings in the Console better with Gemini
- @position-try rules support in Elements > Styles
- Sources panel improvements
- Configure automatic pretty-printing and bracket closing
- Handled rejected promises are recognized as caught
- Error causes in the Console
- Network panel improvements
- Inspect Early Hints headers
- Hide the Waterfall column
- Performance panel improvements
- Capture CSS selector statistics
- Change order and hide tracks
- Ignore retainers in the Memory panel
- Lighthouse 11.7.1
- Miscellaneous highlights
- New Autofill panel
- Enhanced network throttling for WebRTC
- Scroll-driven animations support in the Animations panel
- Improved CSS nesting support in Elements > Styles
- Enhanced Performance panel
- Hide functions and their children in the flame chart
- Arrows from selected initiators to events they initiated
- Lighthouse 11.6.0
- Tooltips for special categories in Memory > Heap snapshots
- Application > Storage updates
- Bytes used for shared storage
- Web SQL is fully deprecated
- Coverage panel improvements
- The Layers panel might be deprecated
- JavaScript Profiler deprecation: Phase four, final
- Miscellaneous highlights
- Find the Easter egg
- Elements panel updates
- Emulate a focused page in Elements > Styles
- Color Picker, Angle Clock, and Easing Editor in
var()fallbacks - CSS length tool is deprecated
- Popover for the selected search result in the Performance > Main track
- Network panel updates
- Clear button and search filter in the Network > EventStream tab
- Tooltips with exemption reasons for third-party cookies in Network > Cookies
- Enable and disable all breakpoints in Sources
- View loaded scripts in DevTools for Node.js
- Lighthouse 11.5.0
- Accessibility improvements
- Miscellaneous highlights
- The official collection of Recorder extensions is live
- Network improvements
- Failure reason in the Status column
- Improved Copy submenu
- Performance improvements
- Breadcrumbs in the Timeline
- Event initiators in the Main track
- JavaScript VM instance selector menu for Node.js DevTools
- New shortcut and command in Sources
- Elements improvements
- The ::view-transition pseudo-element is now editable in Styles
- The align-content property support for block containers
- Posture support for emulated foldable devices
- Dynamic theming
- Third-party cookies phaseout warnings in the Network and Application panels
- Lighthouse 11.4.0
- Accessibility improvements
- Miscellaneous highlights
- Elements improvements
- Streamlined filter bar in the Network panel
@font-palette-valuessupport- Supported case: Custom property as a fallback of another custom property
- Improved source map support
- Performance panel improvements
- Enhanced Interactions track
- Advanced filtering in Bottom-Up, Call Tree, and Event Log tabs
- Indentation markers in the Sources panel
- Helpful tooltips for overridden headers and content in the Network panel
- New Command Menu options for adding and removing request blocking patterns
- The CSP violations experiment is removed
- Lighthouse 11.3.0
- Accessibility improvements
- Miscellaneous highlights
- Third-party cookie phaseout
- Analyze your website's cookies with the Privacy Sandbox Analysis Tool
- Enhanced ignore listing
- Default exclusion pattern for node_modules
- Caught exceptions now stop execution if caught or passing through non-ignored code
x_google_ignoreListrenamed toignoreListin source maps- New input mode toggle during remote debugging
- The Elements panel now shows URLs for #document nodes
- Effective Content Security Policy in the Application panel
- Improved animation debugging
- 'Do you trust this code?' dialog in Sources and self-XSS warning in Console
- Event listener breakpoints in web workers and worklets
- The new media badge for
<audio>and<video> - Preloading renamed to Speculative loading
- Lighthouse 11.2.0
- Accessibility improvements
- Miscellaneous highlights
- Improved @property section in Elements > Styles
- Editable @property rule
- Issues with invalid @property rules are reported
- Updated list of devices to emulate
- Pretty-print inline JSON in script tags in Sources
- Autocomplete private fields in Console
- Lighthouse 11.1.0
- Accessibility improvements
- Web SQL deprecation
- Screenshot aspect ratio validation in Application > Manifest
- Miscellaneous highlights
- New section for custom properties in Elements > Styles
- More local overrides improvements
- Enhanced search
- Improved Sources panel
- Streamlined workspace in the Sources panel
- Reorder panes in Sources
- Syntax highlighting and pretty-printing for more script types
- Emulate prefers-reduced-transparency media feature
- Lighthouse 11
- Accessibility improvements
- Miscellaneous highlights
- Network panel improvements
- Override web content locally even faster
- Override the content of XHR and fetch requests
- Hide Chrome extension requests
- Human-readable HTTP status codes
Performance: See the changes in fetch priority for network events
- Sources settings enabled by default: Code folding and automatic file reveal
- Improved debugging of third-party cookie issues
- New colors
- Lighthouse 10.4.0
- Debug preloading in the Application panel
- The C/C++ WebAssembly debugging extension for DevTools is now open source
- Miscellaneous highlights
- (Experimental) New rendering emulation: prefers-reduced-transparency
- (Experimental) Enhanced Protocol monitor
- Improved debugging of missing stylesheets
- Linear timing support in Elements > Styles > Easing Editor
- Storage buckets support and metadata view
- Lighthouse 10.3.0
- Accessibility: Keyboard commands and improved screen reading
- Miscellaneous highlights
- Elements improvements
- New CSS subgrid badge
- Selector specificity in tooltips
- Values of custom CSS properties in tooltips
- Sources improvements
- CSS syntax highlighting
- Shortcut to set conditional breakpoints