
Google I/O 2025 edition
Chrome DevTools is going to have a strong presence at this year's Google I/O. There's going to be a mix of live sessions and recorded sessions.
To learn about exciting new features, tune in on the following:
- What's new in Chrome, May 20, 2025 | 3:30 pm PT
- Do more with Chrome DevTools and less CTRL + TAB
- Performance debugging in DevTools
Additionally, don't forget to tune in on Rachel Andrew's What's new on the web session, May 20, 2025 | 4:30 pm PT.
Check out our latest video for a quick overview of our latest highlights:
Modify and save CSS changes to your workspace with Gemini
With a few clicks, you can now have Gemini modify and fix CSS for you and, with a connected workspace folder, save your changes back to source files on your computer.
Automatic workspaces are an experimental feature. You can connect your existing source folder or you can try a demo.
With a workspace folder connected, in the Elements panel, click Ask AI, ask Gemini to modify CSS, click Continue to test changes live, then expand Unsaved changes, click Apply to workspace, review the diff, and click Save all.
Connect a workspace folder and save changes back to your source files
You can now automatically (or manually) connect a workspace folder to let DevTools save JavaScript, HTML, and CSS changes back to source files stored on your computer.
Check out how it works with JavaScript:
Chromium issue: 404170628.
Ask Gemini about performance insights
With a click of a button, you can now start a chat with Gemini to investigate and act on the following performance insights:
- LCP by phase
- LCP request discovery
- Render blocking requests
- Layout shift culprits
- Document request latency

Feel free to leave your feedback about the feature in crbug.com/371170842.
Annotate performance findings with Gemini
You can now ask Gemini to generate annotations about events in the performance trace.
Double-click an event in the Main track, then click Generate label next to the input field. Gemini can suggest a label based on the stack trace and context.
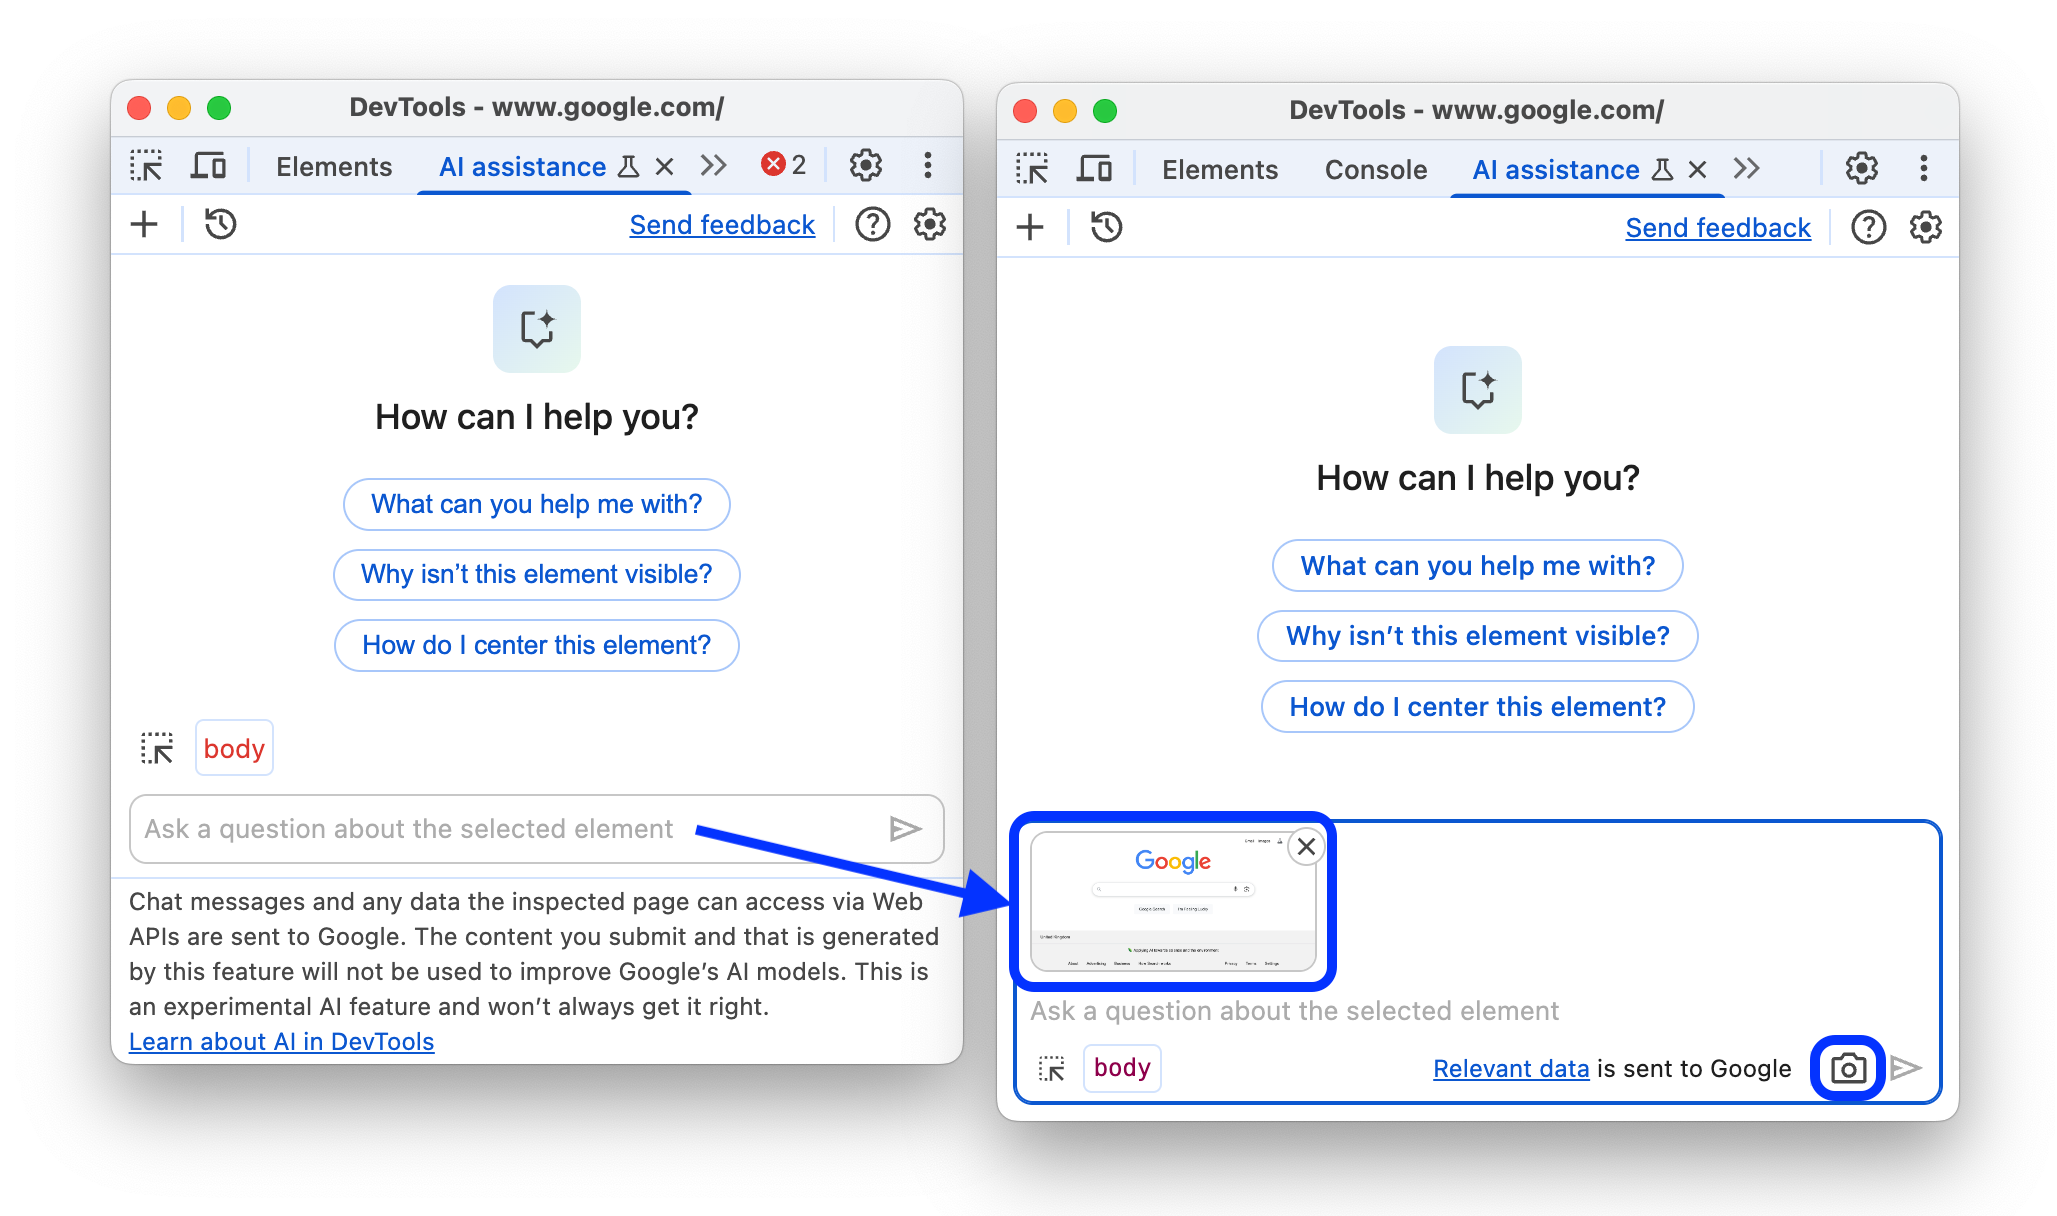
Add screenshots to your chats with Gemini
In the AI assistance panel, you can now click the Take screenshot button to capture a screenshot of the page and submit it to your chat with Gemini.
You can use screenshots to provide additional visual context to your prompts, for example, to check if all visible buttons have the same spacing.
New insights in the Performance panel
This version brings two new insights to the Performance panel: Duplicated JavaScript and Legacy JavaScript.
Duplicated JavaScript
The new Performance > Insights > Duplicated JavaScript will highlight in the Network track the requests for large duplicated JavaScript modules in your bundles if present on your page.

You can also click View Treemap in the insight to explore JavaScript dependencies.
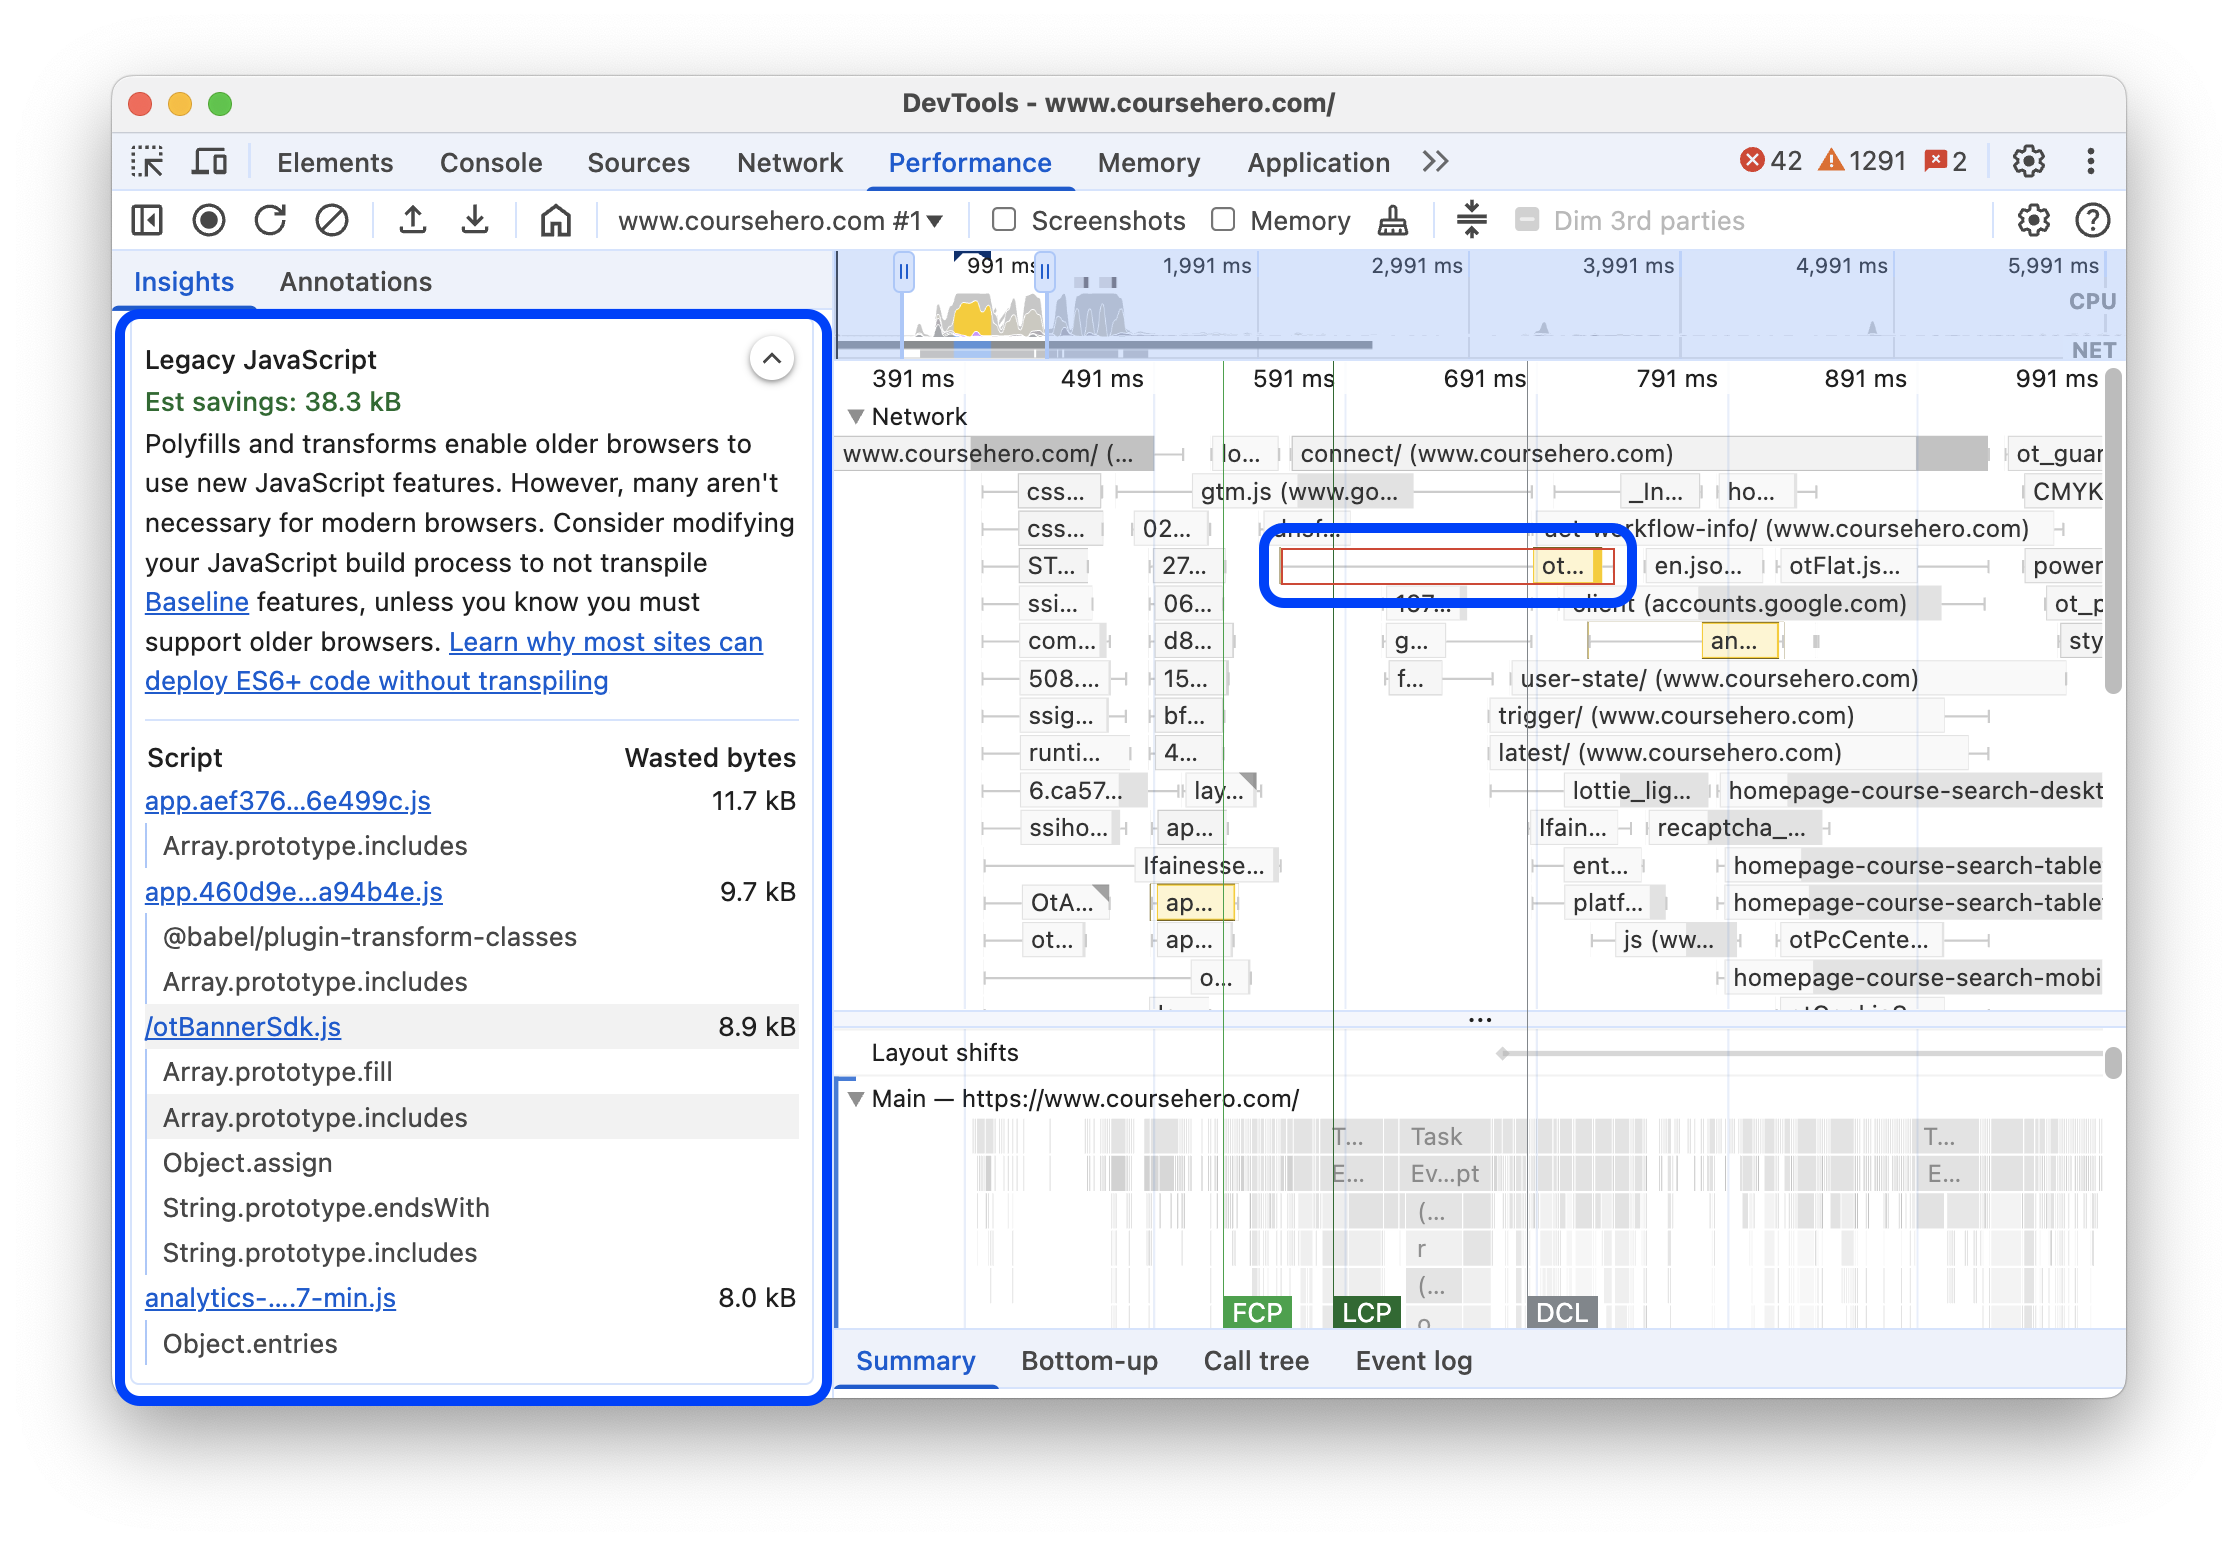
Legacy JavaScript
The new Performance > Insights > Legacy JavaScript will highlight in the Network track the requests for legacy JavaScript if present on your page, for example, polyfills and transforms that enable older browsers to use new JavaScript features. However, many aren't necessary for modern browsers.
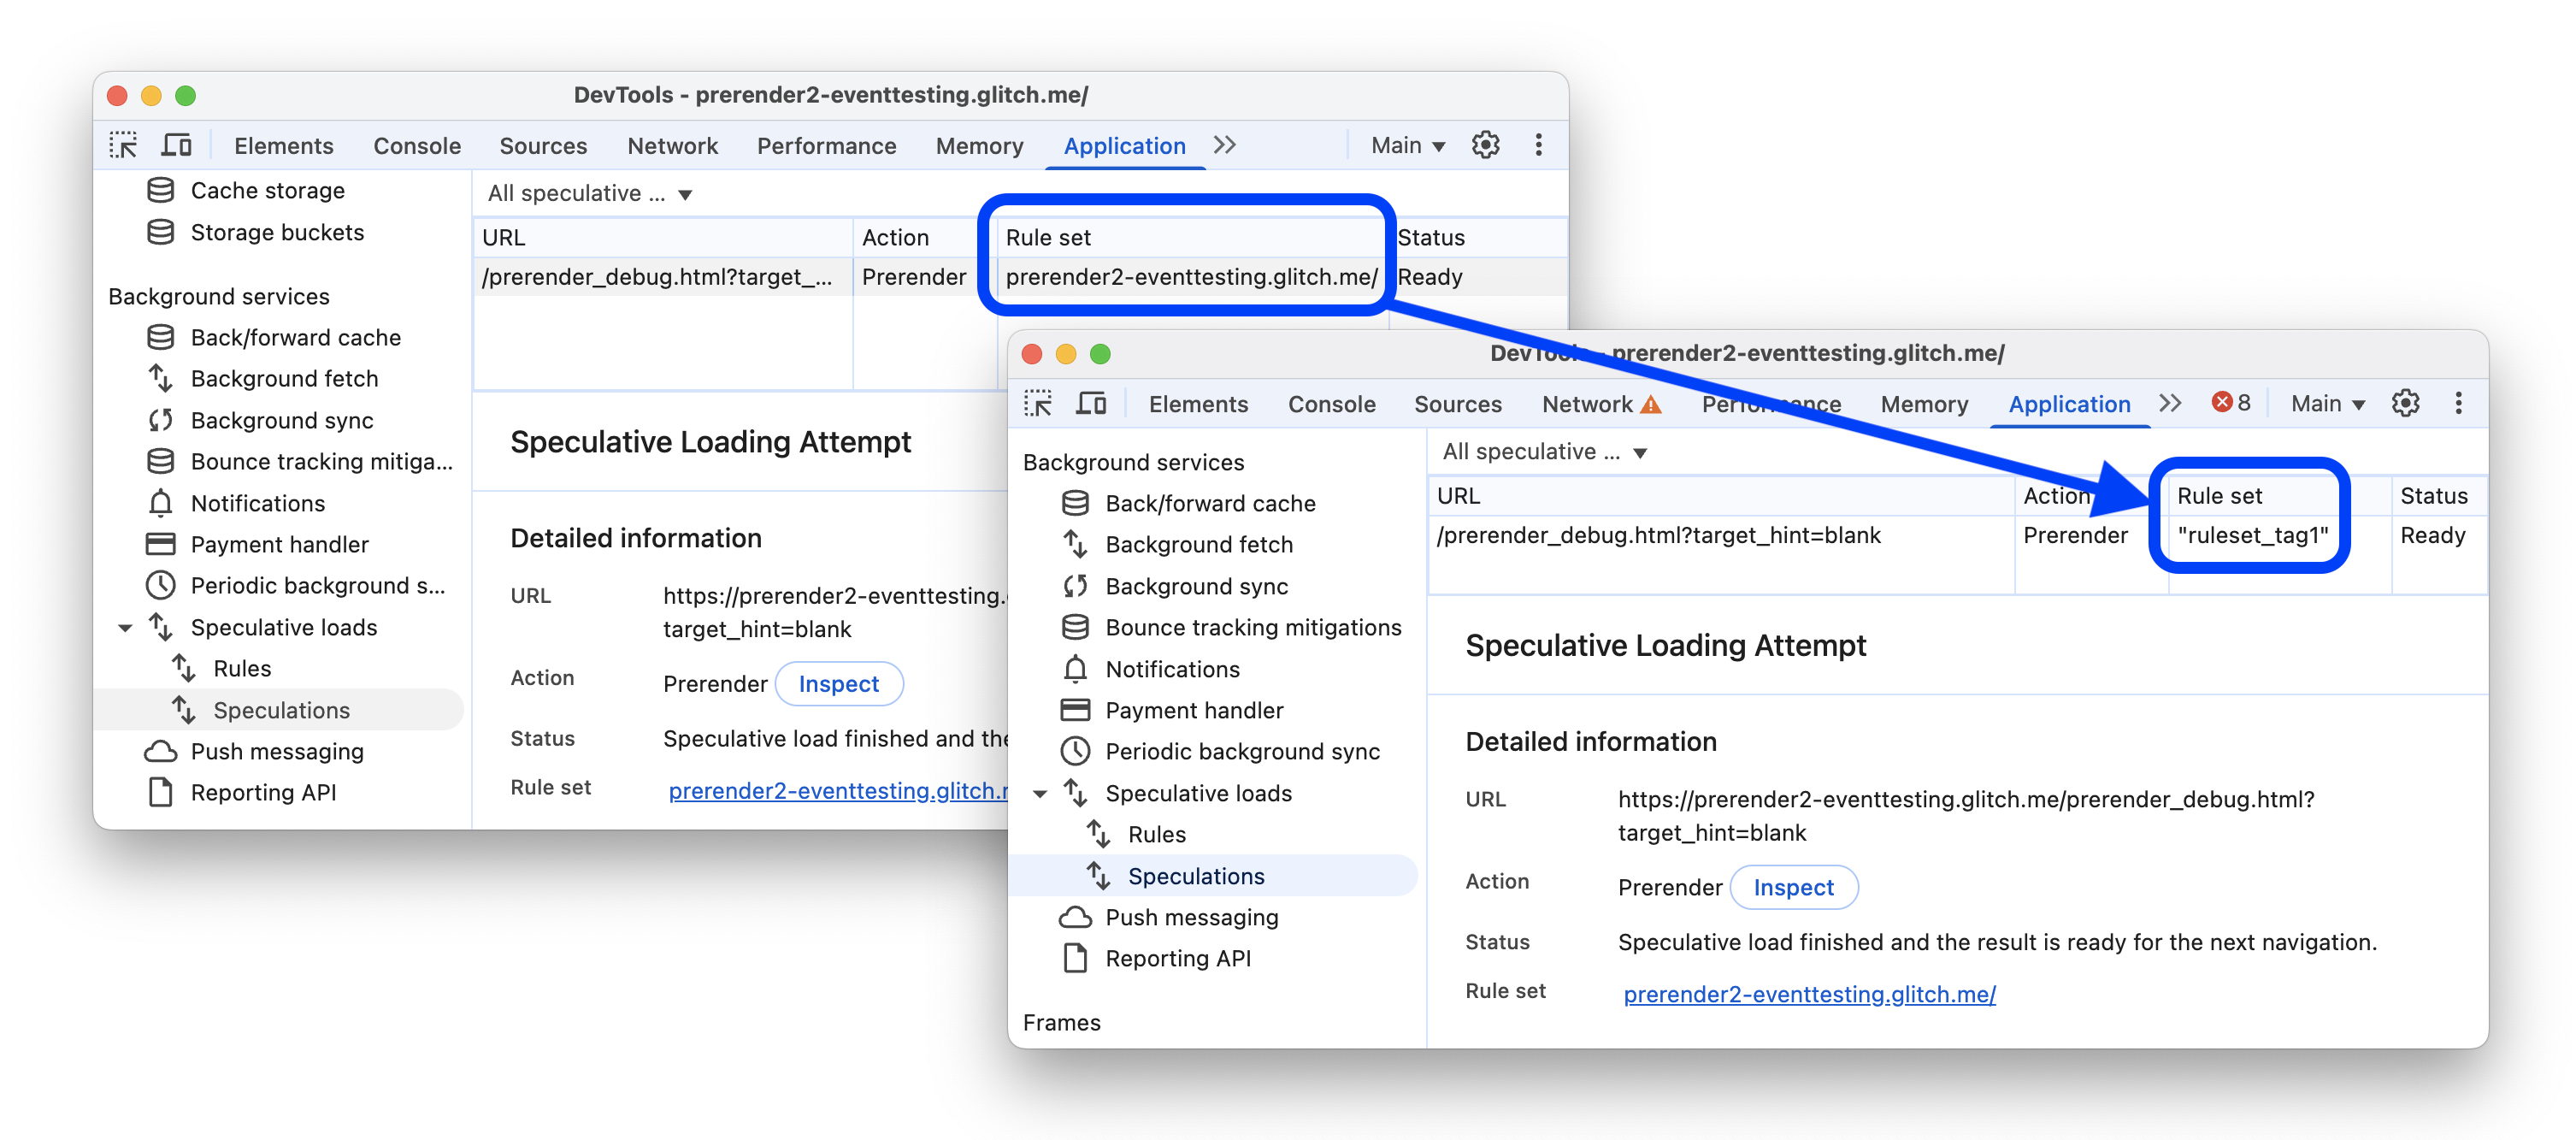
Speculations now support rule tags
The Application > Speculative loads now shows tags instead of URLs for rule sets, if tags are present.
Chromium issue: 393408589.
Lighthouse 12.6.0
The Lighthouse panel now runs Lighthouse 12.6.0.
Most notably in this version, Lighthouse is moving to performance insight audits. In the Performance category of the Lighthouse report, you can now Try insights.

See also the full list of changes.
To learn the basics of using the Lighthouse panel in DevTools, see Lighthouse: Optimize website speed.
Chromium issue: 40543651.
Miscellaneous highlights
These are some noteworthy fixes and improvements in this release:
- Network: Added parsing for known formats of server timings.
- You can now deselect rows in tables with Cmd/Ctrl + click (Chromium issue: 409474445).
- Performance > Insights > Use efficient cache lifetimes now ignores assets with TTL equal or longer than 30 days.
Accessibility
This version brings the following accessibility improvements:
- Performance: Initiator arrows in the trace are now more visible.
- Elements: You can now toggle full-page accessibility tree view with the shortcut A (Chromium issue: 40888478).
Screen readers now announce, among other things:
- "Copied to clipboard" when you copy from code blocks.
- "Applying to workspace" when you apply changes to your workspace in AI assistance chat.
- "Generating label" when you ask AI to generate it in Performance > Annotations.
- Note that there are suggested prompts in the AI assistance chat.
- Read out estimated savings for relevant insights in Performance > Insights.
Download the preview channels
Consider using the Chrome Canary, Dev, or Beta as your default development browser. These preview channels give you access to the latest DevTools features, let you test cutting-edge web platform APIs, and help you find issues on your site before your users do!
Get in touch with the Chrome DevTools team
Use the following options to discuss the new features, updates, or anything else related to DevTools.
- Submit feedback and feature requests to us at crbug.com.
- Report a DevTools issue using the More options > Help > Report a DevTools issue in DevTools.
- Tweet at @ChromeDevTools.
- Leave comments on What's new in DevTools YouTube videos or DevTools Tips YouTube videos.
What's new in DevTools
A list of everything that has been covered in the What's new in DevTools series.
- DevTools MCP server updates
- Improved trace sharing
- Support for @starting-style
- Editor widget for display: masonry
- Lighthouse 13
- Code suggestions from Gemini
- Enhancements for the DevTools MCP server
- Quicker access to AI assistance
- Debug the full performance trace with Gemini
- Toggle drawer orientation
- Google Developer Program
- Miscellaneous highlights
- Chrome DevTools (MCP) for your AI agent
- Debug the network dependency tree with Gemini
- Export your chats with Gemini
- Persisted track configuration in the Performance panel
- Filter IP protected network requests
- Elements > Layout tab adds masonry layout support
- Lighthouse 12.8.2
- Miscellaneous highlights
- Debug more insights with Gemini
- Emulate the 'Save-Data' header in 'Network conditions'
- See the Baseline status in a CSS property tooltip
- Override form factors in user agent client hints
- Lighthouse 12.8.0
- Miscellaneous highlights
- A more reliable and productive Chrome DevTools
- Upload images in AI assistance for styling
- Add request headers to the table in Network
- Check out the highlights from Google I/O 2025
- Miscellaneous highlights
- Performance panel improvements
- Preconnected origins in 'Network dependency tree' insight
- Server response and redirection times in 'Document request latency' insight
- Redirects in Summary of network requests
- Reduced noise in the performance trace
- Deprecated 'Disable JavaScript samples'
- Geolocation accuracy parameter in Sensors
- Elements panel improvements
- Debug complex CSS values easier
- @function support in Elements > Styles
- Network panel improvements
- has-request-header filter
- Direct Sockets in Isolated Web Apps