
The official collection of Recorder extensions is live
The official collection of export and replay Recorder extensions is now live.
To open the collection directly from the Recorder, select Export > Get extensions... on the action bar at the top of the Recorder panel.
Network improvements
This version brings a number of improvements to the Network panel.
Failure reason in the Status column
The Status column now always shows a failure reason. Previously, you had to turn on Big request rows or select the request in the table.

Chromium issues: 1506760.
Improved Copy submenu
The Copy submenu of a request is now better organized.

Additionally, the Copy as cURL option now copies the correct command to clipboard on Windows.
Chromium issues: 1267033, 1276452, 798498.
Performance improvements
This version brings a number of improvements to the Performance panel.
Breadcrumbs in the Timeline
The Timeline at the top of the Performance panel now lets you set breadcrumbs and jump between them.
To set a breadcrumb, select a range on the Timeline, hover over it, and click the N ms button. You can create several nested breadcrumbs in succession. To jump between zoom levels, click the corresponding breadcrumb in the chain on top of the Timeline. Watch the next video to see breadcrumbs in action.
Chromium issues: 1467739.
Event initiators in the Main track
The Performance > Main track by default now shows arrows connecting initiators and the following events they caused.
- Style or layout invalidation -> Recalculate styles or Layout
- Request Animation Frame -> Animation Frame Fired
- Request Idle Callback -> Fire Idle Callback
- Install Timer -> Timer Fired
- Create WebSocket -> Send... and Receive WebSocket Handshake or Destroy WebSocket
To see the arrows, find such an event in the trace and click it. Previously, this feature was an experiment.

Chromium issues: 1434596.
JavaScript VM instance selector menu for Node.js DevTools
In the Performance panel of Node.js DevTools, you can now select a JavaScript VM instance from the corresponding drop-down menu in the action bar. A similar feature was available in the soon-to-be-deprecated JavaScript Profiler.

Chromium issues: 1511813.
Elements improvements
This version brings a number of improvements to the Elements panel.
In addition to the next two features, the Elements panel now remembers the last tab you opened, for example Computed or Properties.
The ::view-transition pseudo-element is now editable in Styles
You can now edit the ::view-transition CSS pseudo-elements in Styles using the inspector style sheet.

For more information, see Smooth and simple transitions with the View Transitions API.
Chromium issues: 1511233.
The align-content property support for block containers
The align-content property now works with any block containers, including table-caption and table-cell. Previously, it worked only with grid and flex.

Chromium issues: 1500511.
New shortcut and command in Sources
You can now Cmd (Mac) / Ctrl (Win) + Shift + click a line number in Sources to create a logpoint. This shortcut is an addition to the already existing Cmd (Mac) / Ctrl (Win) + click for conditional breakpoints.
The Command Menu gets the new Reveal active file in navigator sidebar command that does the same as the corresponding option in the drop-down menu of the Editor.

Chromium issues: 1486933, 1467464.
Posture support for emulated foldable devices
Device mode now lets you set posture of an emulated foldable device: Continuous or Folded. The continuous posture refers to a "flat" position and folded forms an angle between sections of the display.
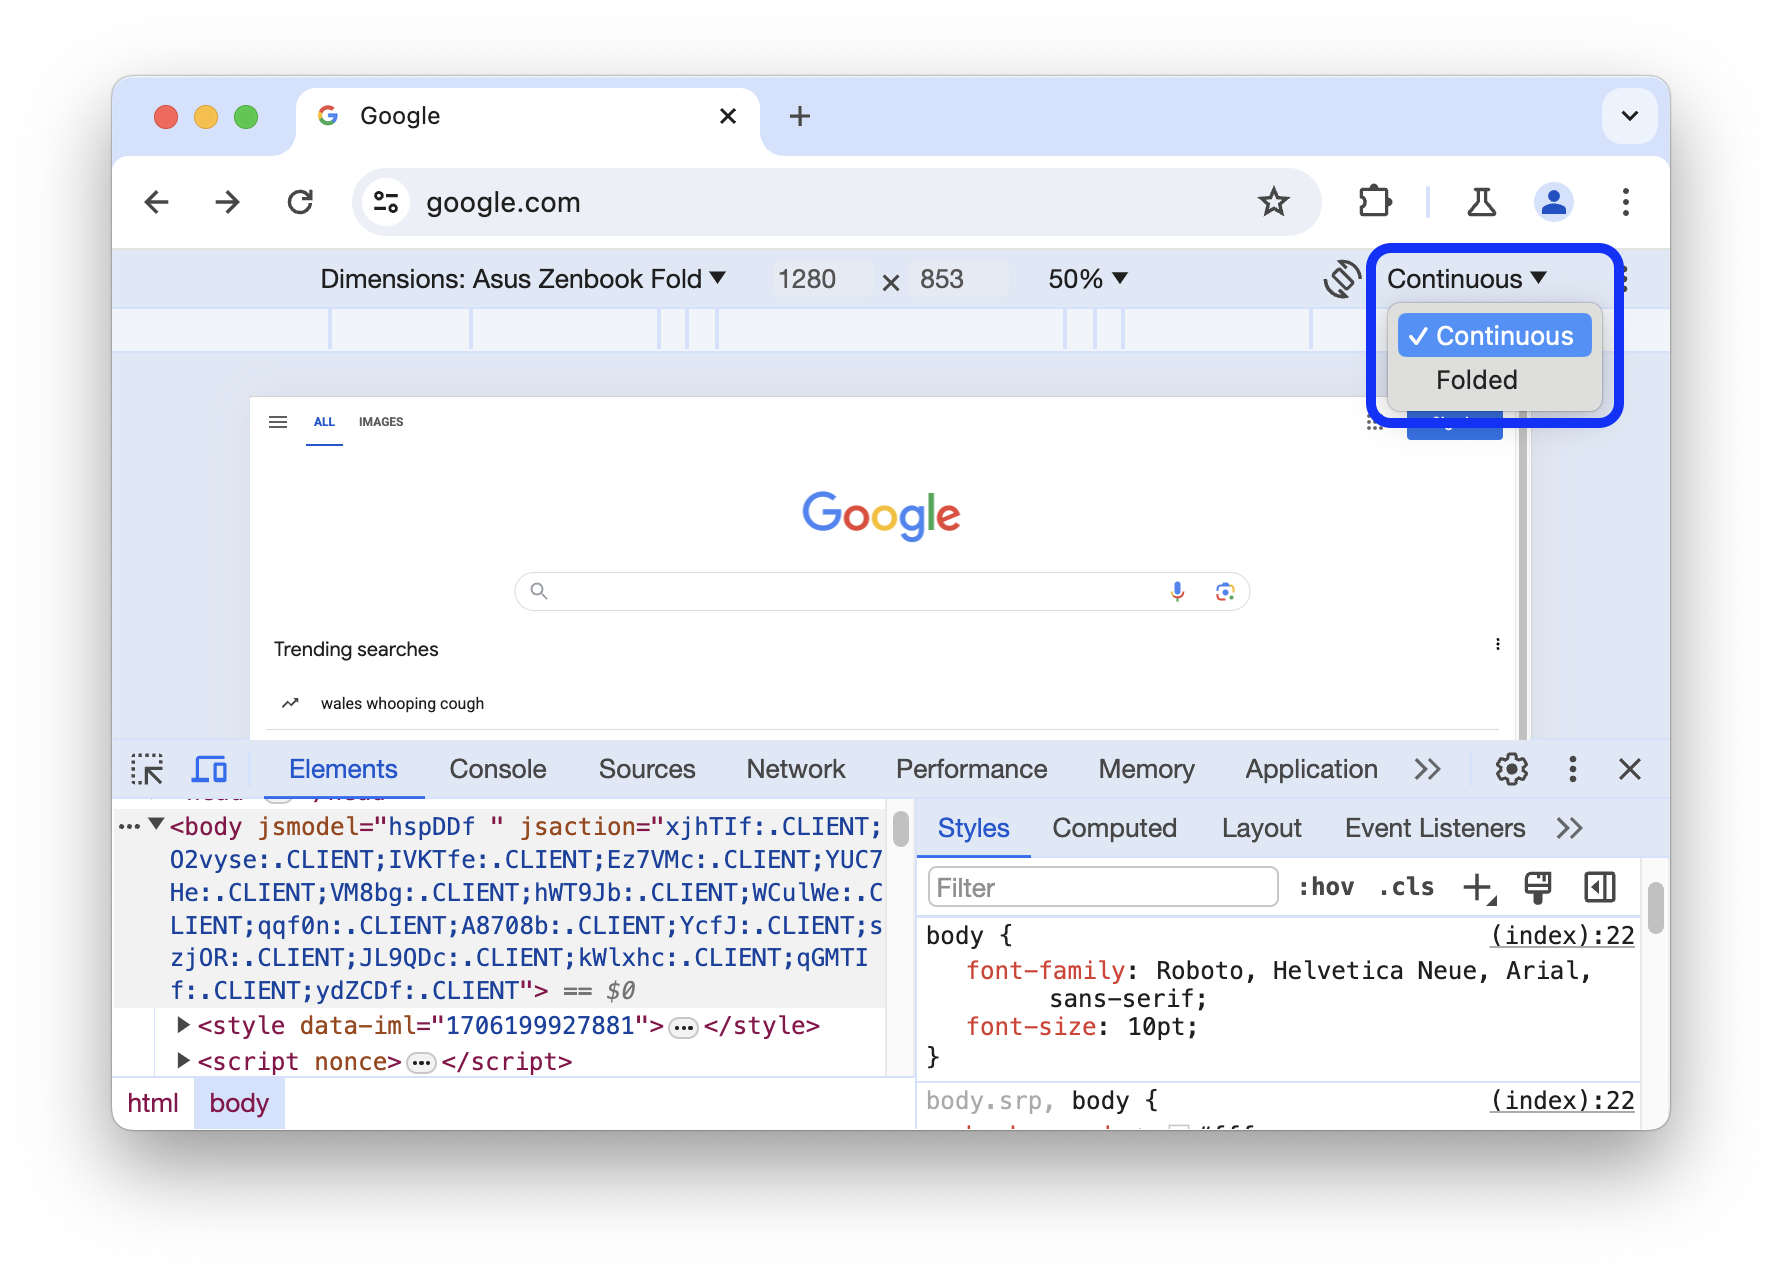
Additionally, the Devices list gets a new emulated foldable device: Asus Zenbook Fold.
Chromium issue: 1066842.
Dynamic theming
DevTools now automatically matches Chrome's color theme. To set a theme:
- Open a new tab and click Customize Chrome in the right bottom corner.
- In Appearance, pick a theme through Change themes or select a color palette.