
Capture double-click and right-click events in the Recorder panel
The Recorder panel can now capture double-click and right-click events.
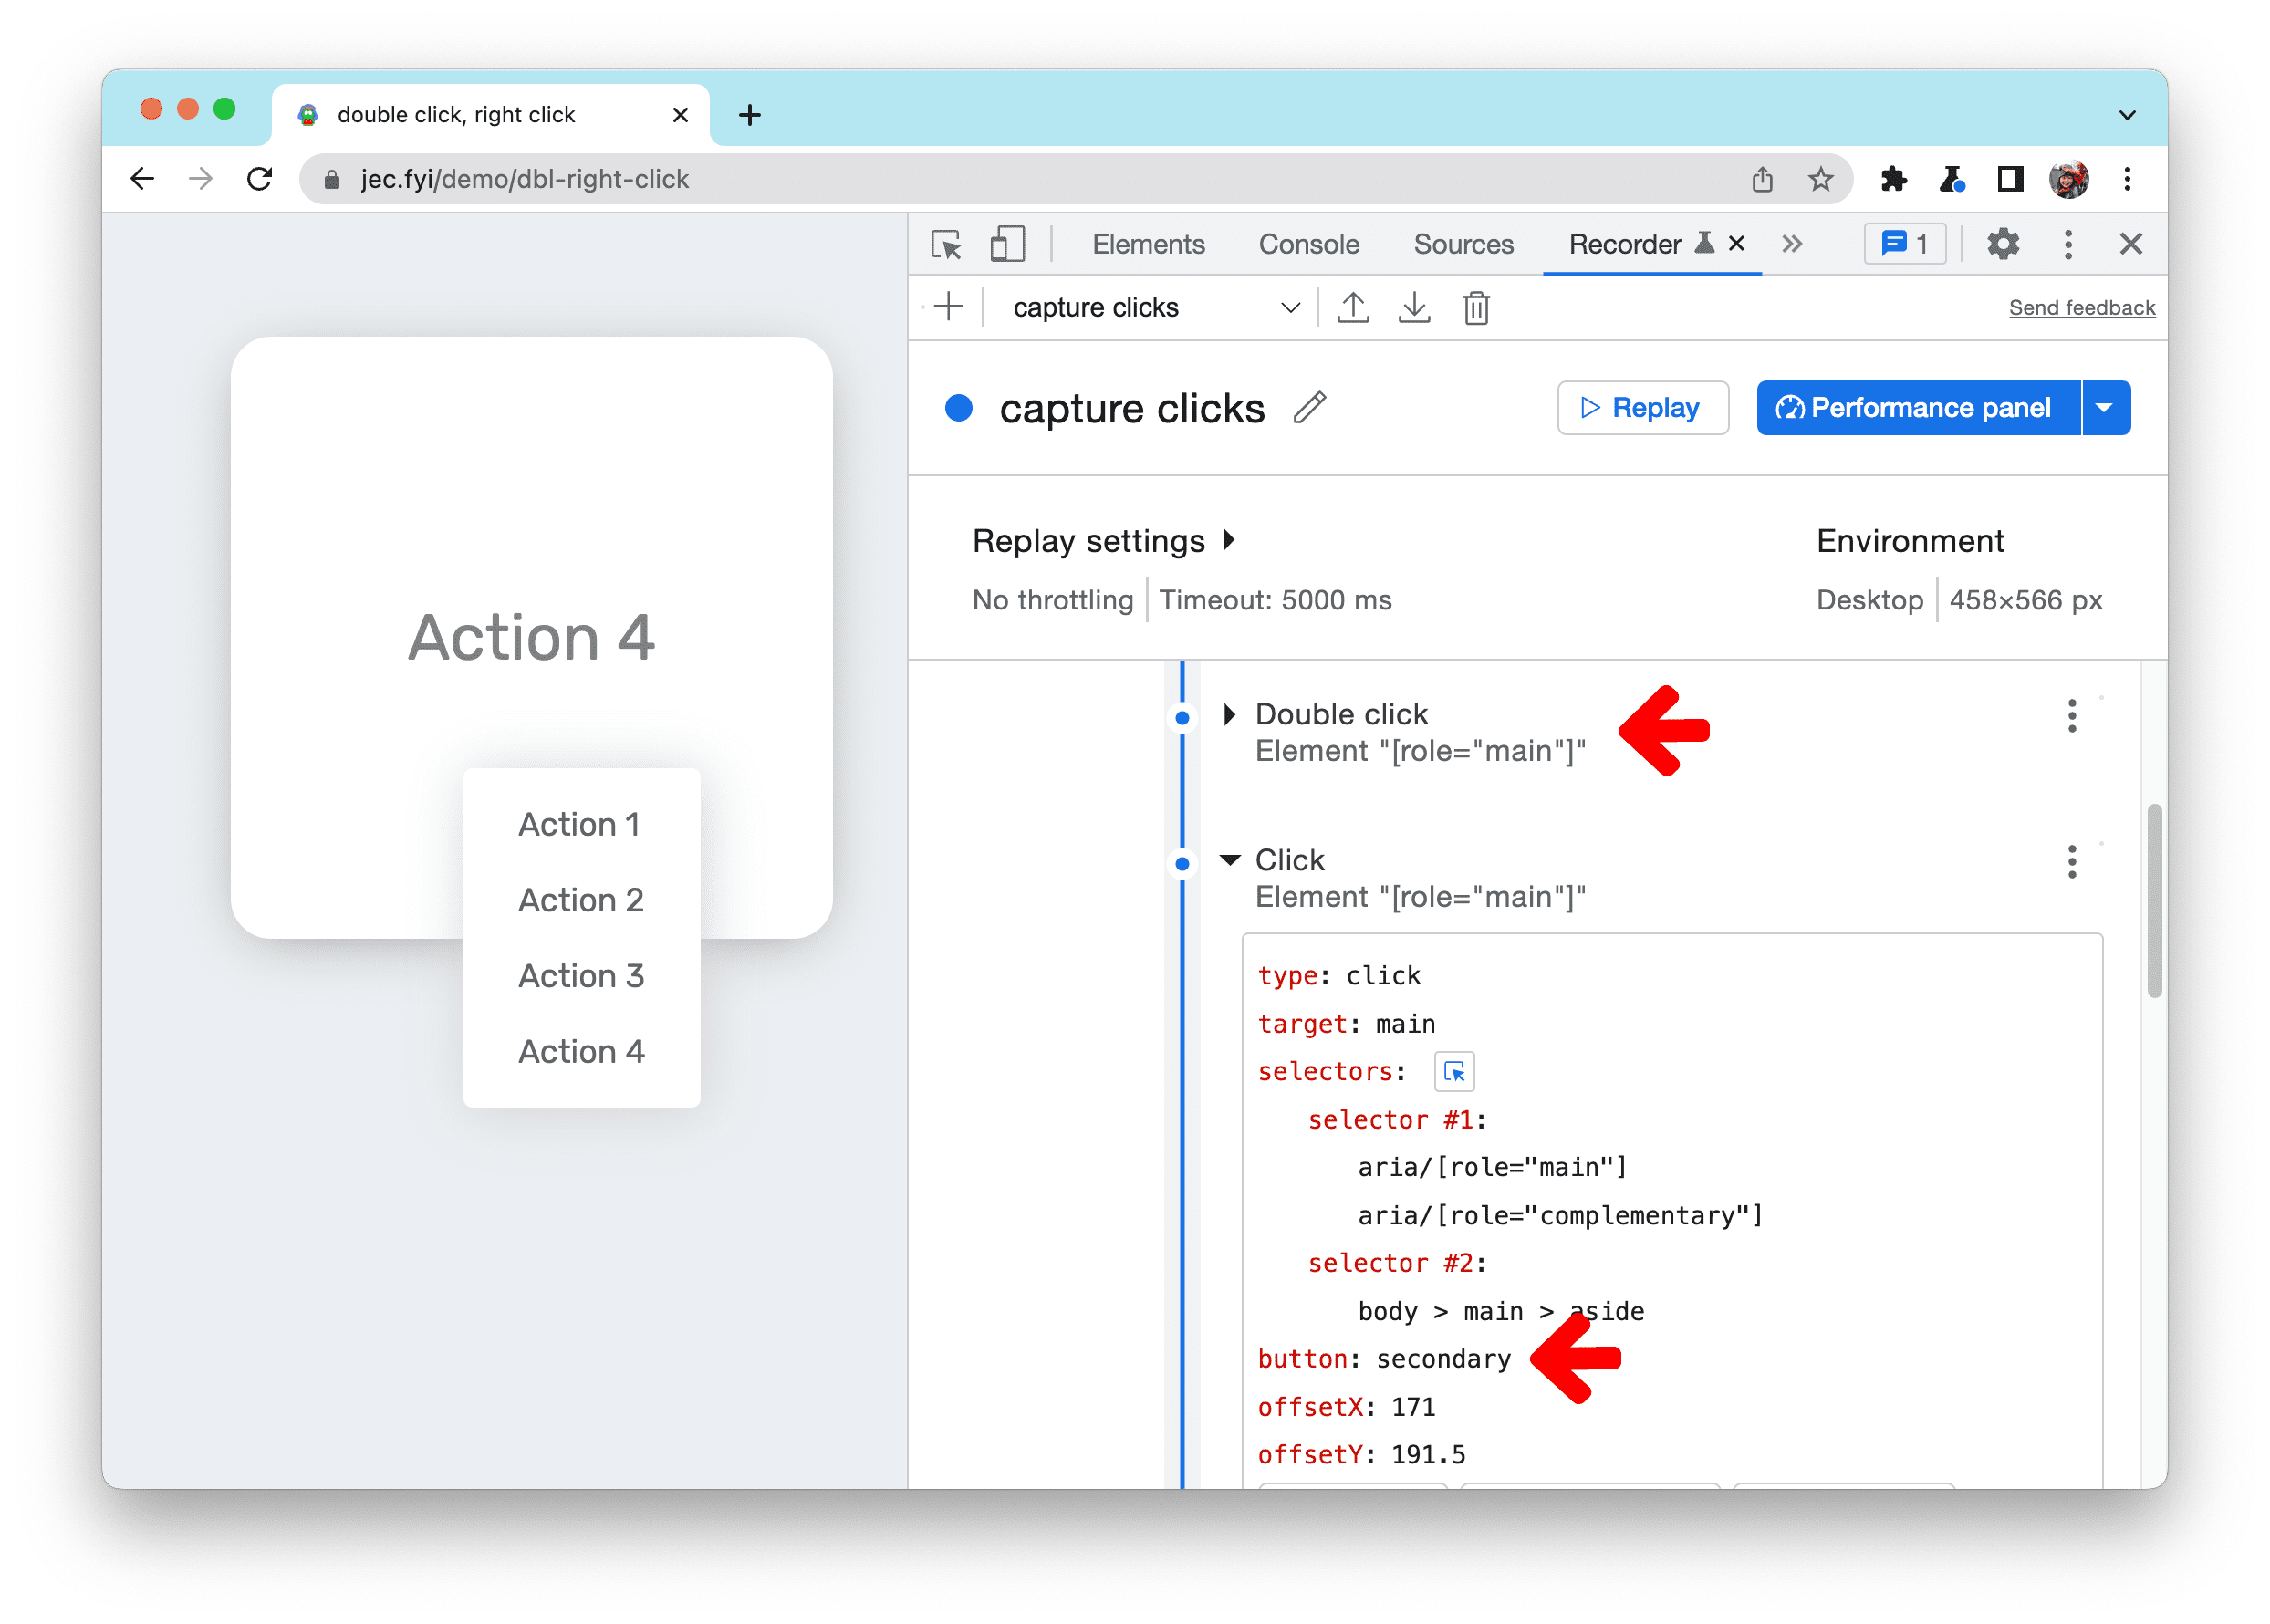
In this example, start a recording and try to perform the following steps:
- Double-click the card to enlarge it
- Right-click the card and select an action from the context menu
To understand how Recorder captured these events, expand the steps:
- Double-click is captured as
type: doubleClick. - Right-click event is captured as
type: clickbut with thebuttonproperty is set tosecondary. Thebuttonvalue of a normal mouse click isprimary.
Chromium issues: 1300839, 1322879, 1299701, 1323688
New timespan and snapshot mode in the Lighthouse panel
You can now use Lighthouse to measure your website’s performance beyond page load.

The Lighthouse panel now supports 3 modes of user flow measurement:
- Navigation reports analyze a single page load. Navigation is the most common report type. All Lighthouse reports before the current version are navigation reports.
- Timespans reports analyze an arbitrary time period, typically containing user interactions.
- Snapshots reports analyze the page in a particular state, typically after the user has interacted with it.
For example, let’s measure the performance of adding items to cart on this demo page. Select the Timespan mode and click Start timespan. Scroll and add a few items to the cart. Once you are done, click on End timespan to generate a Lighthouse report of the user interactions.

See User flows in Lighthouse to learn about the unique use cases, benefits, and limitations of each mode.
Chromium issue: 1291284
Performance Insights updates
Improved zoom control in the Performance Insights panel
DevTools will now zoom in based on your mouse cursor rather than the playhead position.With the latest cursor-based zoom, you can move your mouse to anywhere in the track, and zoom in to the desired area right away.
See Performance Insights to learn how to get actionable insights and improve your website’s performance with the panel.
Chromium issue: 1313382
Confirm to delete a performance recording
DevTools now shows a confirmation dialog before deleting a performance recording.

Chromium issue: 1318087
Reorder panes in the Elements panel
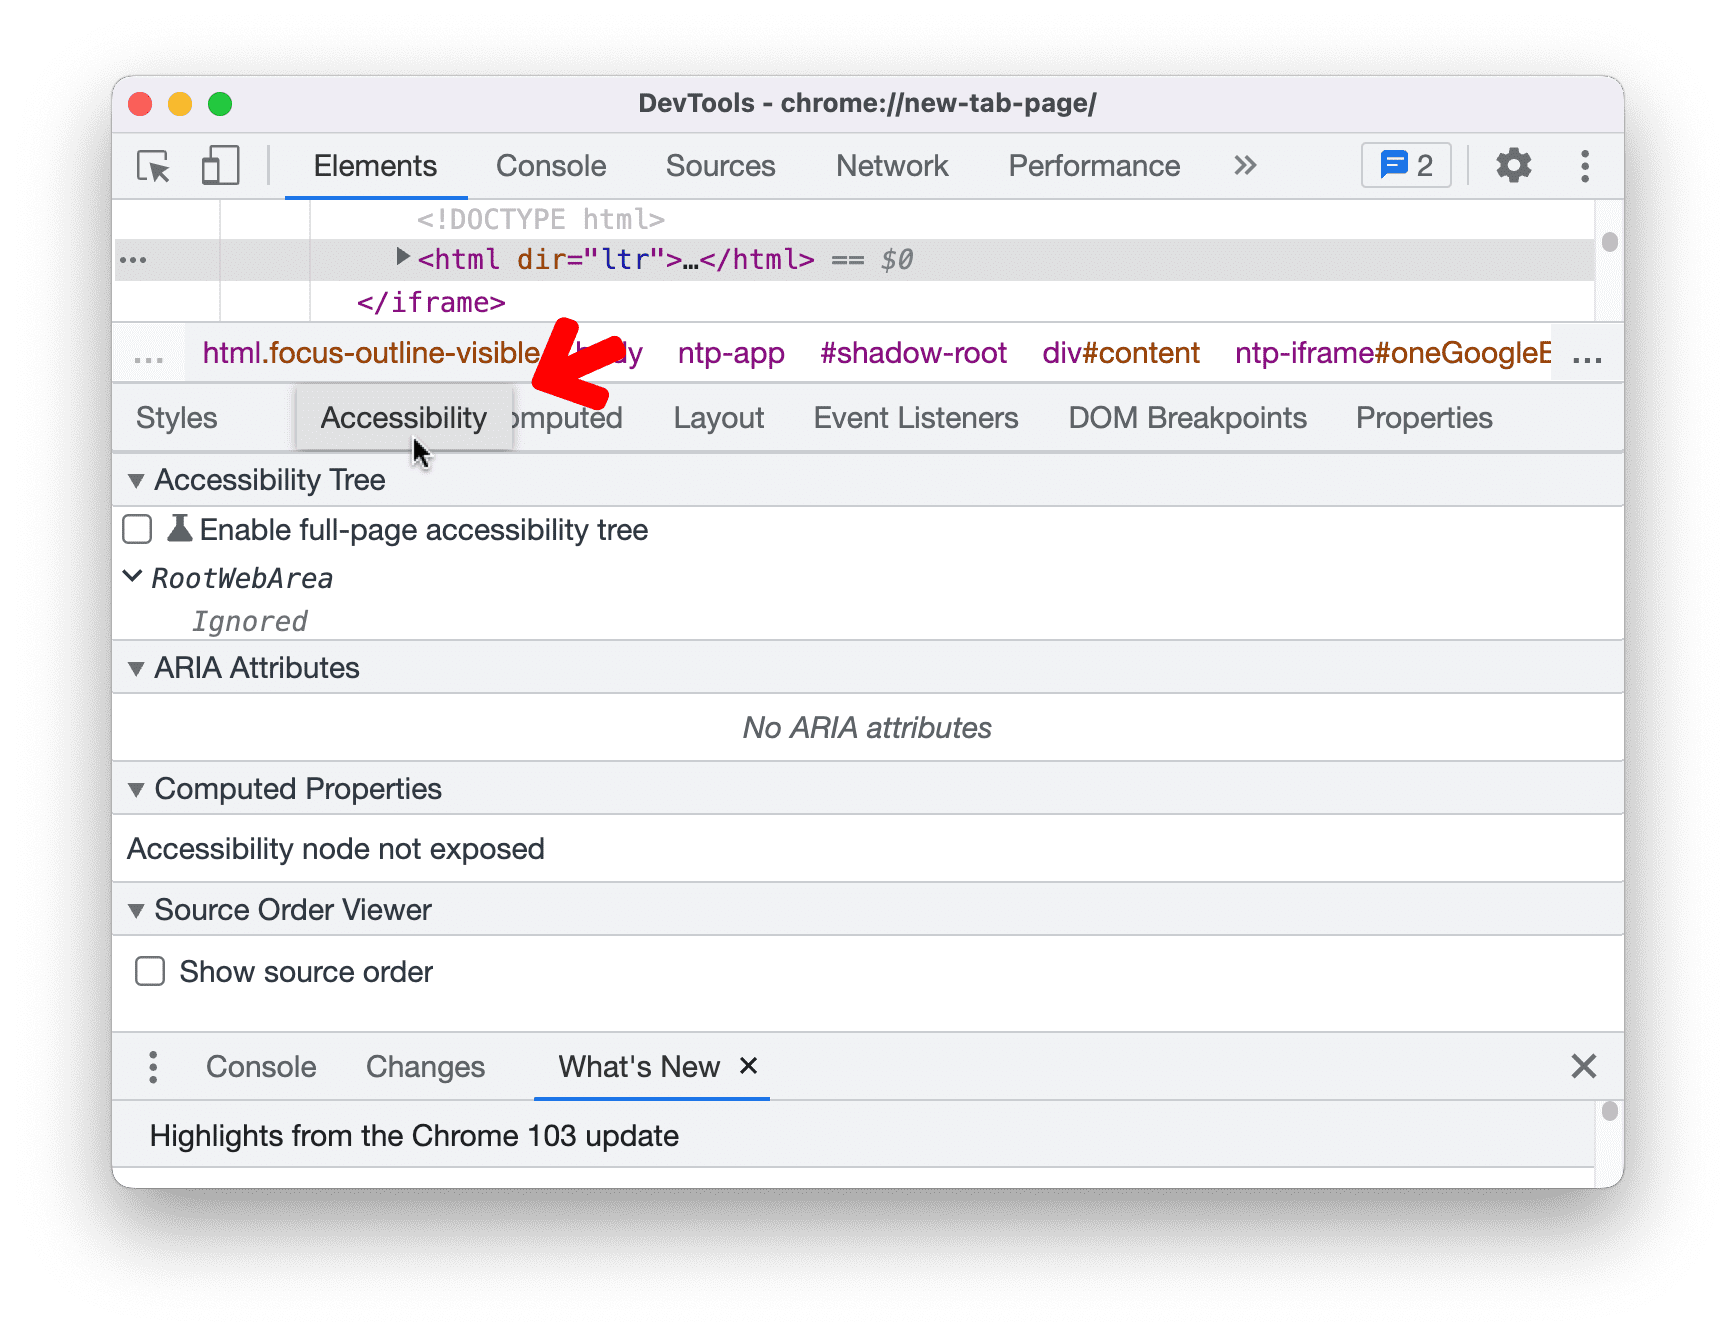
You can now reorder panes in the Elements panel based on your preference.
For example, when you open DevTools on a narrow screen, the Accessibility pane is hidden under the Show more button. If you frequently debug accessibility issues, you can now drag the pane to the front for easier access.
Chromium issue: 1146146
Picking a color outside of the browser
DevTools now supports picking a color outside of the browser. Previously, you could only pick a color within the browser.
In the Styles pane, click on any color preview to open a color picker. Use the eyedropper to pick color from anywhere.

Chromium issue: 1245191
Improved inline value preview during debugging
The debugger now shows the inline values preview correctly.
In this example, the double function has an input parameter a and a variable x. Put a breakpoint at the return line and run the code. The inline preview shows values a and x correctly. Previously, the debugger did not show the value x in the inline preview.

Chromium issue: 1316340
Support large blobs for virtual authenticators
The WebAuthn tab now has the new Supports large blob checkbox for virtual authenticators.
This checkbox is disabled by default. You can enable it only for the authenticators with ctap2 protocol that support resident keys.

Chromium issue: 1321803
New keyboard shortcuts in the Sources panel
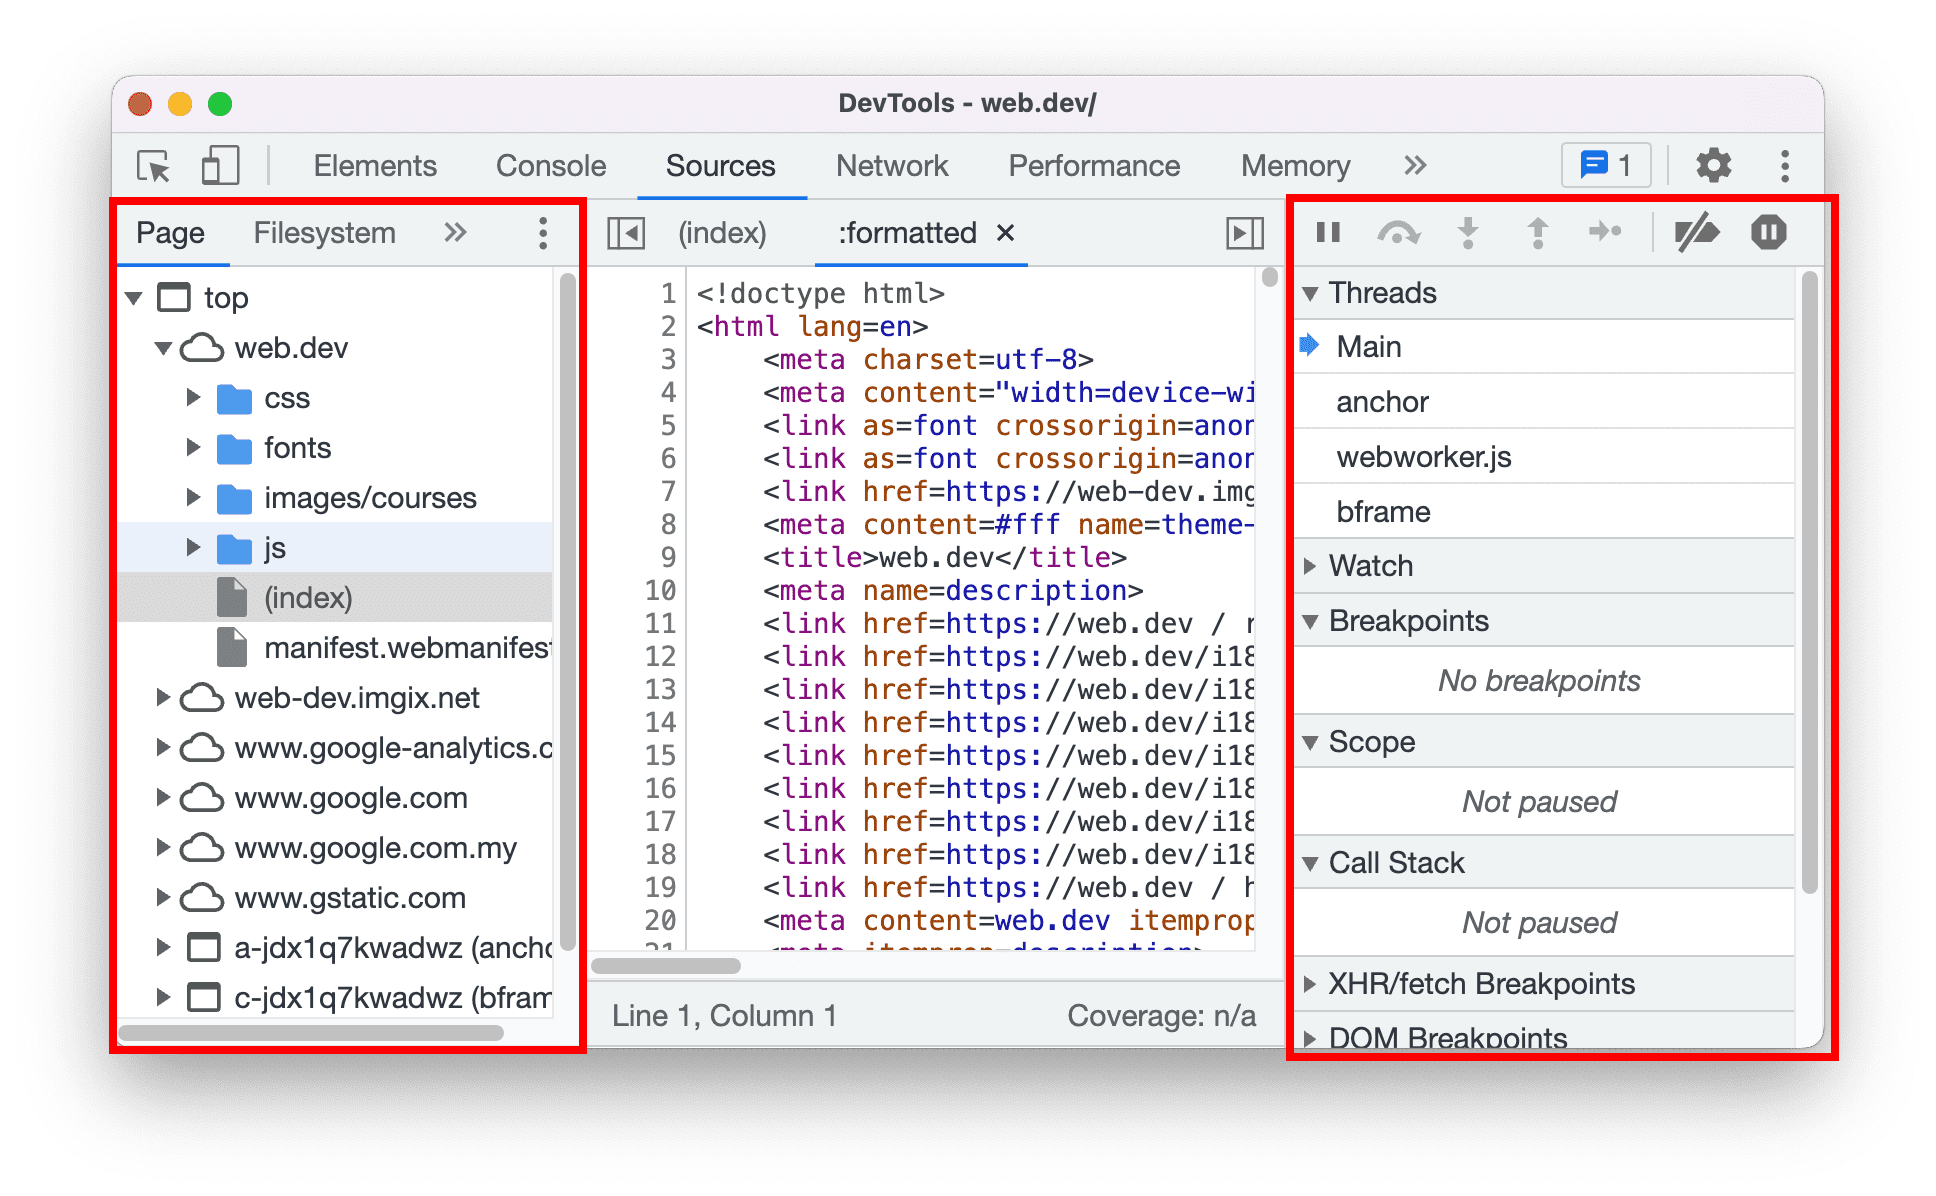
Two new keyboard shortcuts are now available in the Sources panel:
- Toggle navigation sidebar (left) with Control / Command + Shift + Y
- Toggle debugger sidebar (right) with Control / Command + Shift + H
Chromium issues: 1226363
Source maps improvements
Previously, developers experience random failure during:
- Debugging with Codepen example
- Identifying source location of performance issues in a Codepen example
- Missing Component tab when React DevTools is enabled
Here are a few fixes on source maps to improve the overall debugging experience:
- Correct mapping between location and offset for inline scripts and source location
- Use fallback information for frame’s text location
- Properly resolve relative urls with frame's URL
Chromium issues: 1319828, 1318635, 1305475
Download the preview channels
Consider using the Chrome Canary, Dev, or Beta as your default development browser. These preview channels give you access to the latest DevTools features, let you test cutting-edge web platform APIs, and help you find issues on your site before your users do!
Get in touch with the Chrome DevTools team
Use the following options to discuss the new features, updates, or anything else related to DevTools.
- Submit feedback and feature requests to us at crbug.com.
- Report a DevTools issue using the More options > Help > Report a DevTools issue in DevTools.
- Tweet at @ChromeDevTools.
- Leave comments on What's new in DevTools YouTube videos or DevTools Tips YouTube videos.
What's new in DevTools
A list of everything that has been covered in the What's new in DevTools series.
- DevTools MCP server updates
- Improved trace sharing
- Support for @starting-style
- Editor widget for display: masonry
- Lighthouse 13
- Code suggestions from Gemini
- Enhancements for the DevTools MCP server
- Quicker access to AI assistance
- Debug the full performance trace with Gemini
- Toggle drawer orientation
- Google Developer Program
- Miscellaneous highlights
- Chrome DevTools (MCP) for your AI agent
- Debug the network dependency tree with Gemini
- Export your chats with Gemini
- Persisted track configuration in the Performance panel
- Filter IP protected network requests
- Elements > Layout tab adds masonry layout support
- Lighthouse 12.8.2
- Miscellaneous highlights
- Debug more insights with Gemini
- Emulate the 'Save-Data' header in 'Network conditions'
- See the Baseline status in a CSS property tooltip
- Override form factors in user agent client hints
- Lighthouse 12.8.0
- Miscellaneous highlights
- A more reliable and productive Chrome DevTools
- Upload images in AI assistance for styling
- Add request headers to the table in Network
- Check out the highlights from Google I/O 2025
- Miscellaneous highlights
- Performance panel improvements
- Preconnected origins in 'Network dependency tree' insight
- Server response and redirection times in 'Document request latency' insight
- Redirects in Summary of network requests
- Reduced noise in the performance trace
- Deprecated 'Disable JavaScript samples'
- Geolocation accuracy parameter in Sensors
- Elements panel improvements
- Debug complex CSS values easier
- @function support in Elements > Styles
- Network panel improvements
- has-request-header filter
- Direct Sockets in Isolated Web Apps
- Miscellaneous highlights
- Accessibility
- Google I/O 2025 edition
- Modify and save CSS changes to your workspace with Gemini
- Connect a workspace folder and save changes back to your source files
- Ask Gemini about performance insights
- Annotate performance findings with Gemini
- Add screenshots to your chats with Gemini
- New insights in the Performance panel
- Duplicated JavaScript
- Legacy JavaScript
- Speculations now support rule tags
- Lighthouse 12.6.0
- Miscellaneous highlights
- Accessibility
- Performance panel improvements
- New performance insights
- Click to highlight
- Server timings in Summary of network requests
- Filter cookies in 'Privacy and security'
- Sizes in kB units in tables across panels
- Autocomplete supports corner-shape and corner-*-shape in Elements > Styles
- Experimental: Highlighting issues with elements and attributes in DOM
- Lighthouse 12.5.0
- Miscellaneous highlights
- Performance panel improvements
- Origin and script links for profile and function calls in Performance
- LCP by phase field data support
- Network dependency tree insight
- Duration instead of total and self time in Summary
- Heaviest stack highlighting
- Improved empty states for various panels
- Accessibility tree view in Elements
- Lighthouse 12.4.0
- Miscellaneous highlights
- Privacy and security panel
- Performance panel improvements
- Calibrated CPU throttling presets
- Select different performance events in the same AI chat
- First- and third-party highlighting in Performance
- Field data in marker tooltips and insights
- Forced reflow insight
- 'Optimize DOM size' insight
- Extend the performance trace with console.timeStamp
- Elements panel improvements
- Real-time values of animated styles
- Support for :open pseudo-class and various pseudo-elements
- Copy all console messages
- Byte units in the Memory panel
- Miscellaneous highlights
- Persistent AI chat history
- Performance panel improvements