
WebAssembly debugging support
DevTools enables Settings > Experiments >
WebAssembly Debugging: Enable DWARF support by default. For more information, see Debugging WebAssembly with modern tools.
This experiment lets you pause execution and debug C and C++ code in Wasm apps, with all the debugging information available to you:
- Your original source code, mapped using DWARF debugging information.
- Understandable function names in call stack.
- Breakpoints support, and more.
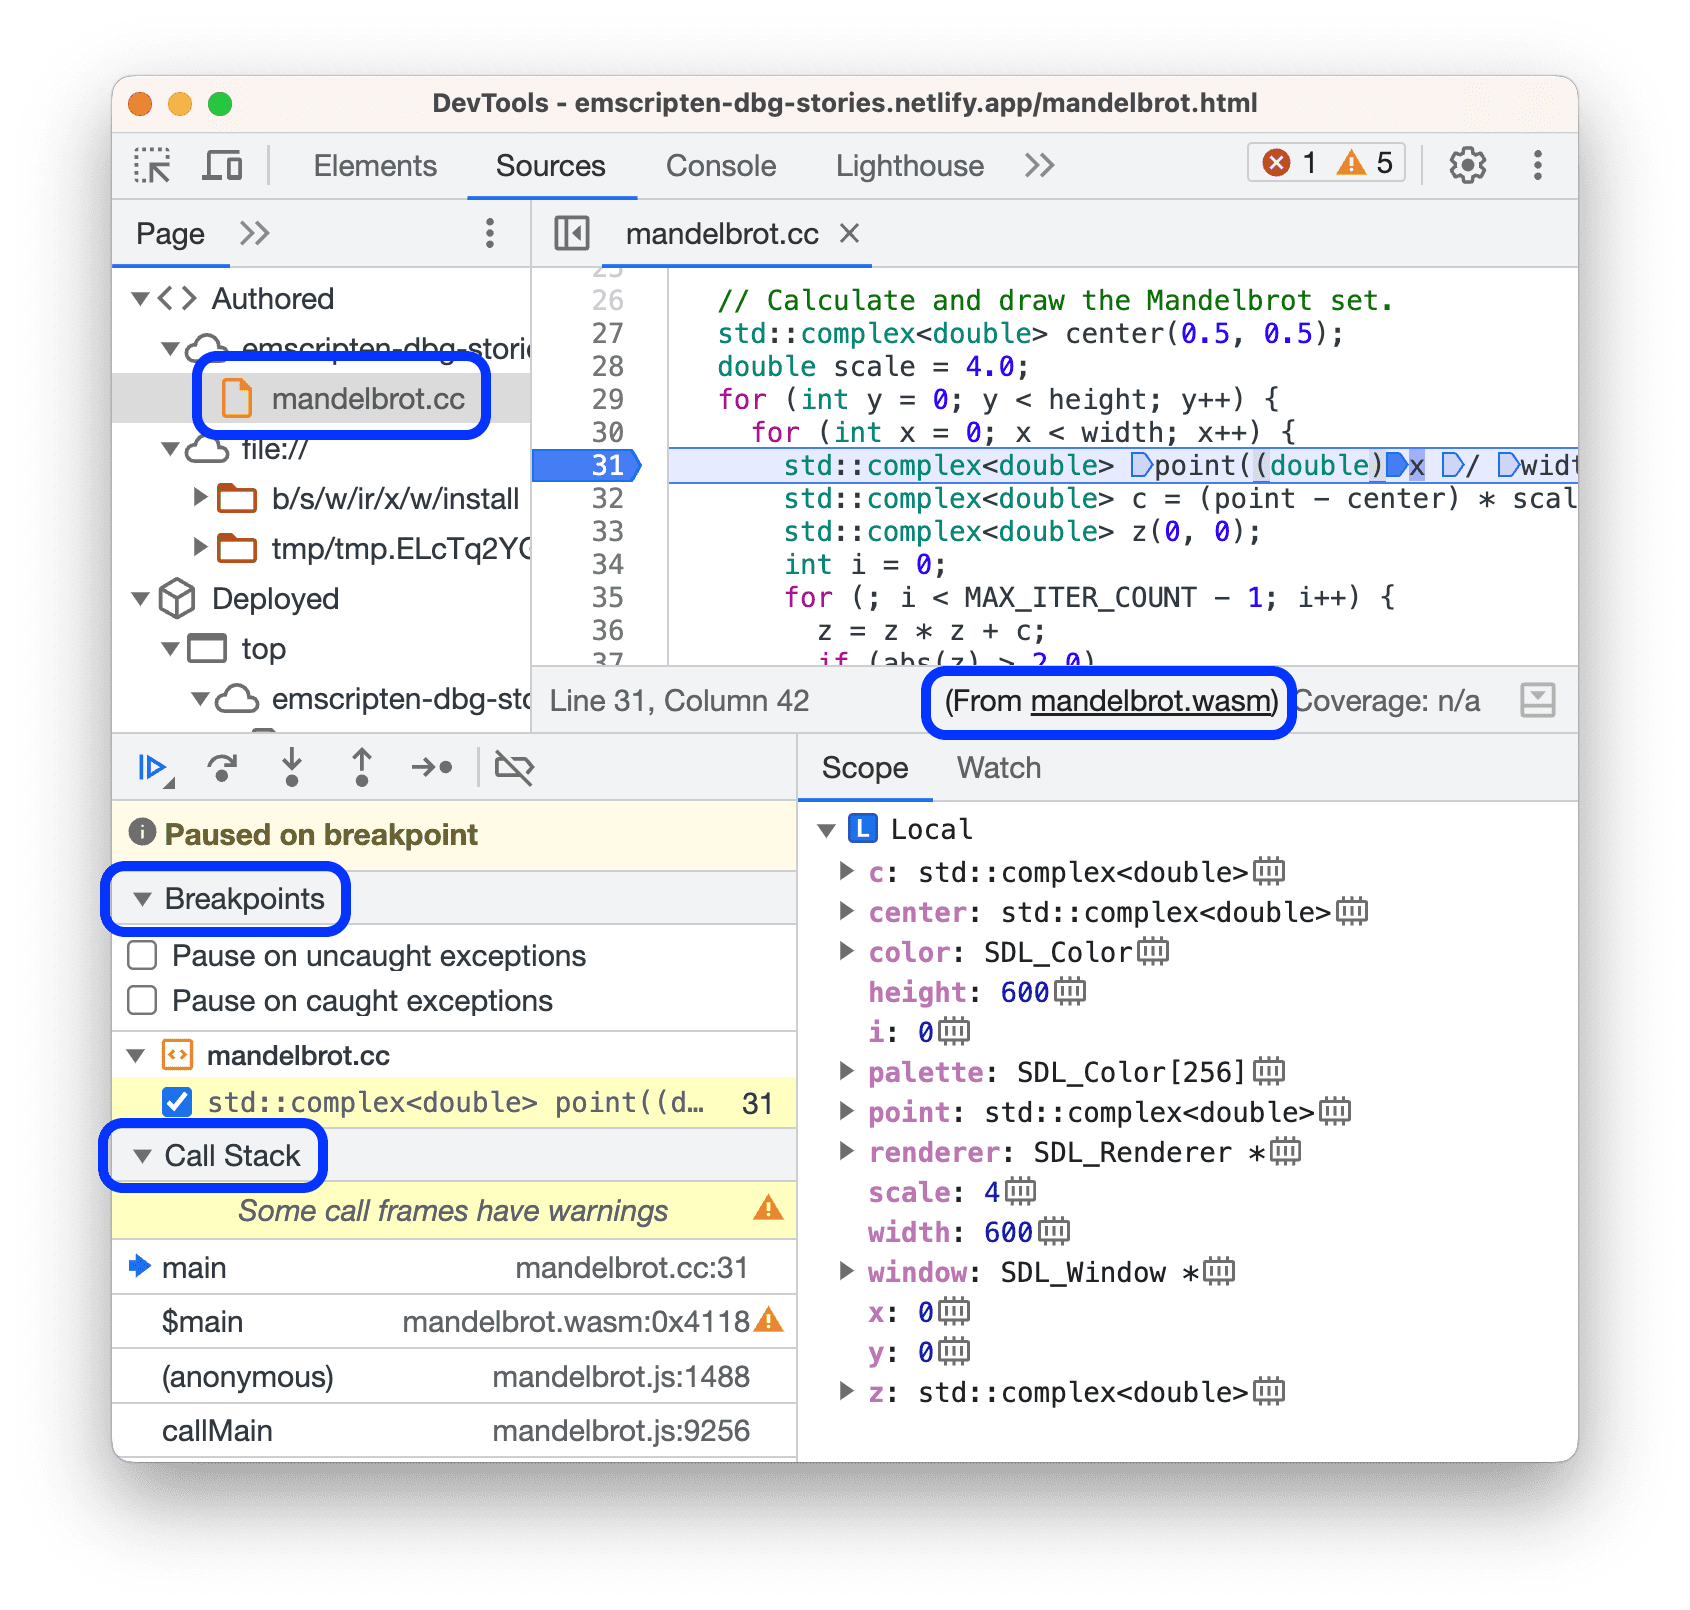
To test Wasm debugging, install the C/C++ DevTools Support (DWARF) extension and step through the code in the Mandelbrot demo.
Chromium issue: 1414289.
Improved stepping behavior in Wasm apps
Step over in your original code now avoids pausing in disassembly (
.wasm file). Previously, it would pause there.
However, stepping ends when it lands outside of the function it started in, for example, after returning from the function.
This behavior is enabled by default in Settings > Preferences > Sources.

Chromium issue: 1418938.
Debug Autofill using the Elements panel and Issues tab
Chrome Autofill fills in forms automatically with saved information, like your addresses or payment information. To let you easily debug Autofill-related issues, the Elements panel can now highlight them with red curly underlines.
To check out this feature, enable Settings > Experiments >
Highlights a violating node or attribute in the Elements panel DOM tree and inspect this demo page.

Hover over a highlighted issue in the DOM tree and click View issue to open the Issues tab that lists all detected issues and provides clues on what went wrong.
Chromium issue: 1399414.
Assertions in Recorder
The Recorder panel now lets you add assertions right during recording, with all the runtime data available to you.
To add an assertion, start a new recording, interact with your page, and click Add assertion. The Recorder inserts a step with the waitForElement type that you can customize on the fly. Watch the video to see assertions in action on the coffee cart demo.
This video shows you how to assert:
- HTML attributes, for example, an element's
class. - JavaScript properties in JSON, for example,
.innerText.
You can also configure steps to assert, for example, conditional statements in JavaScript, number of node's children (count), element visibility, and more. For more information, see Configure steps.
Additionally, the Recorder now remembers your preferred script format in the side-by-side code view and right-click step menu.
Chromium issue: 1423624.
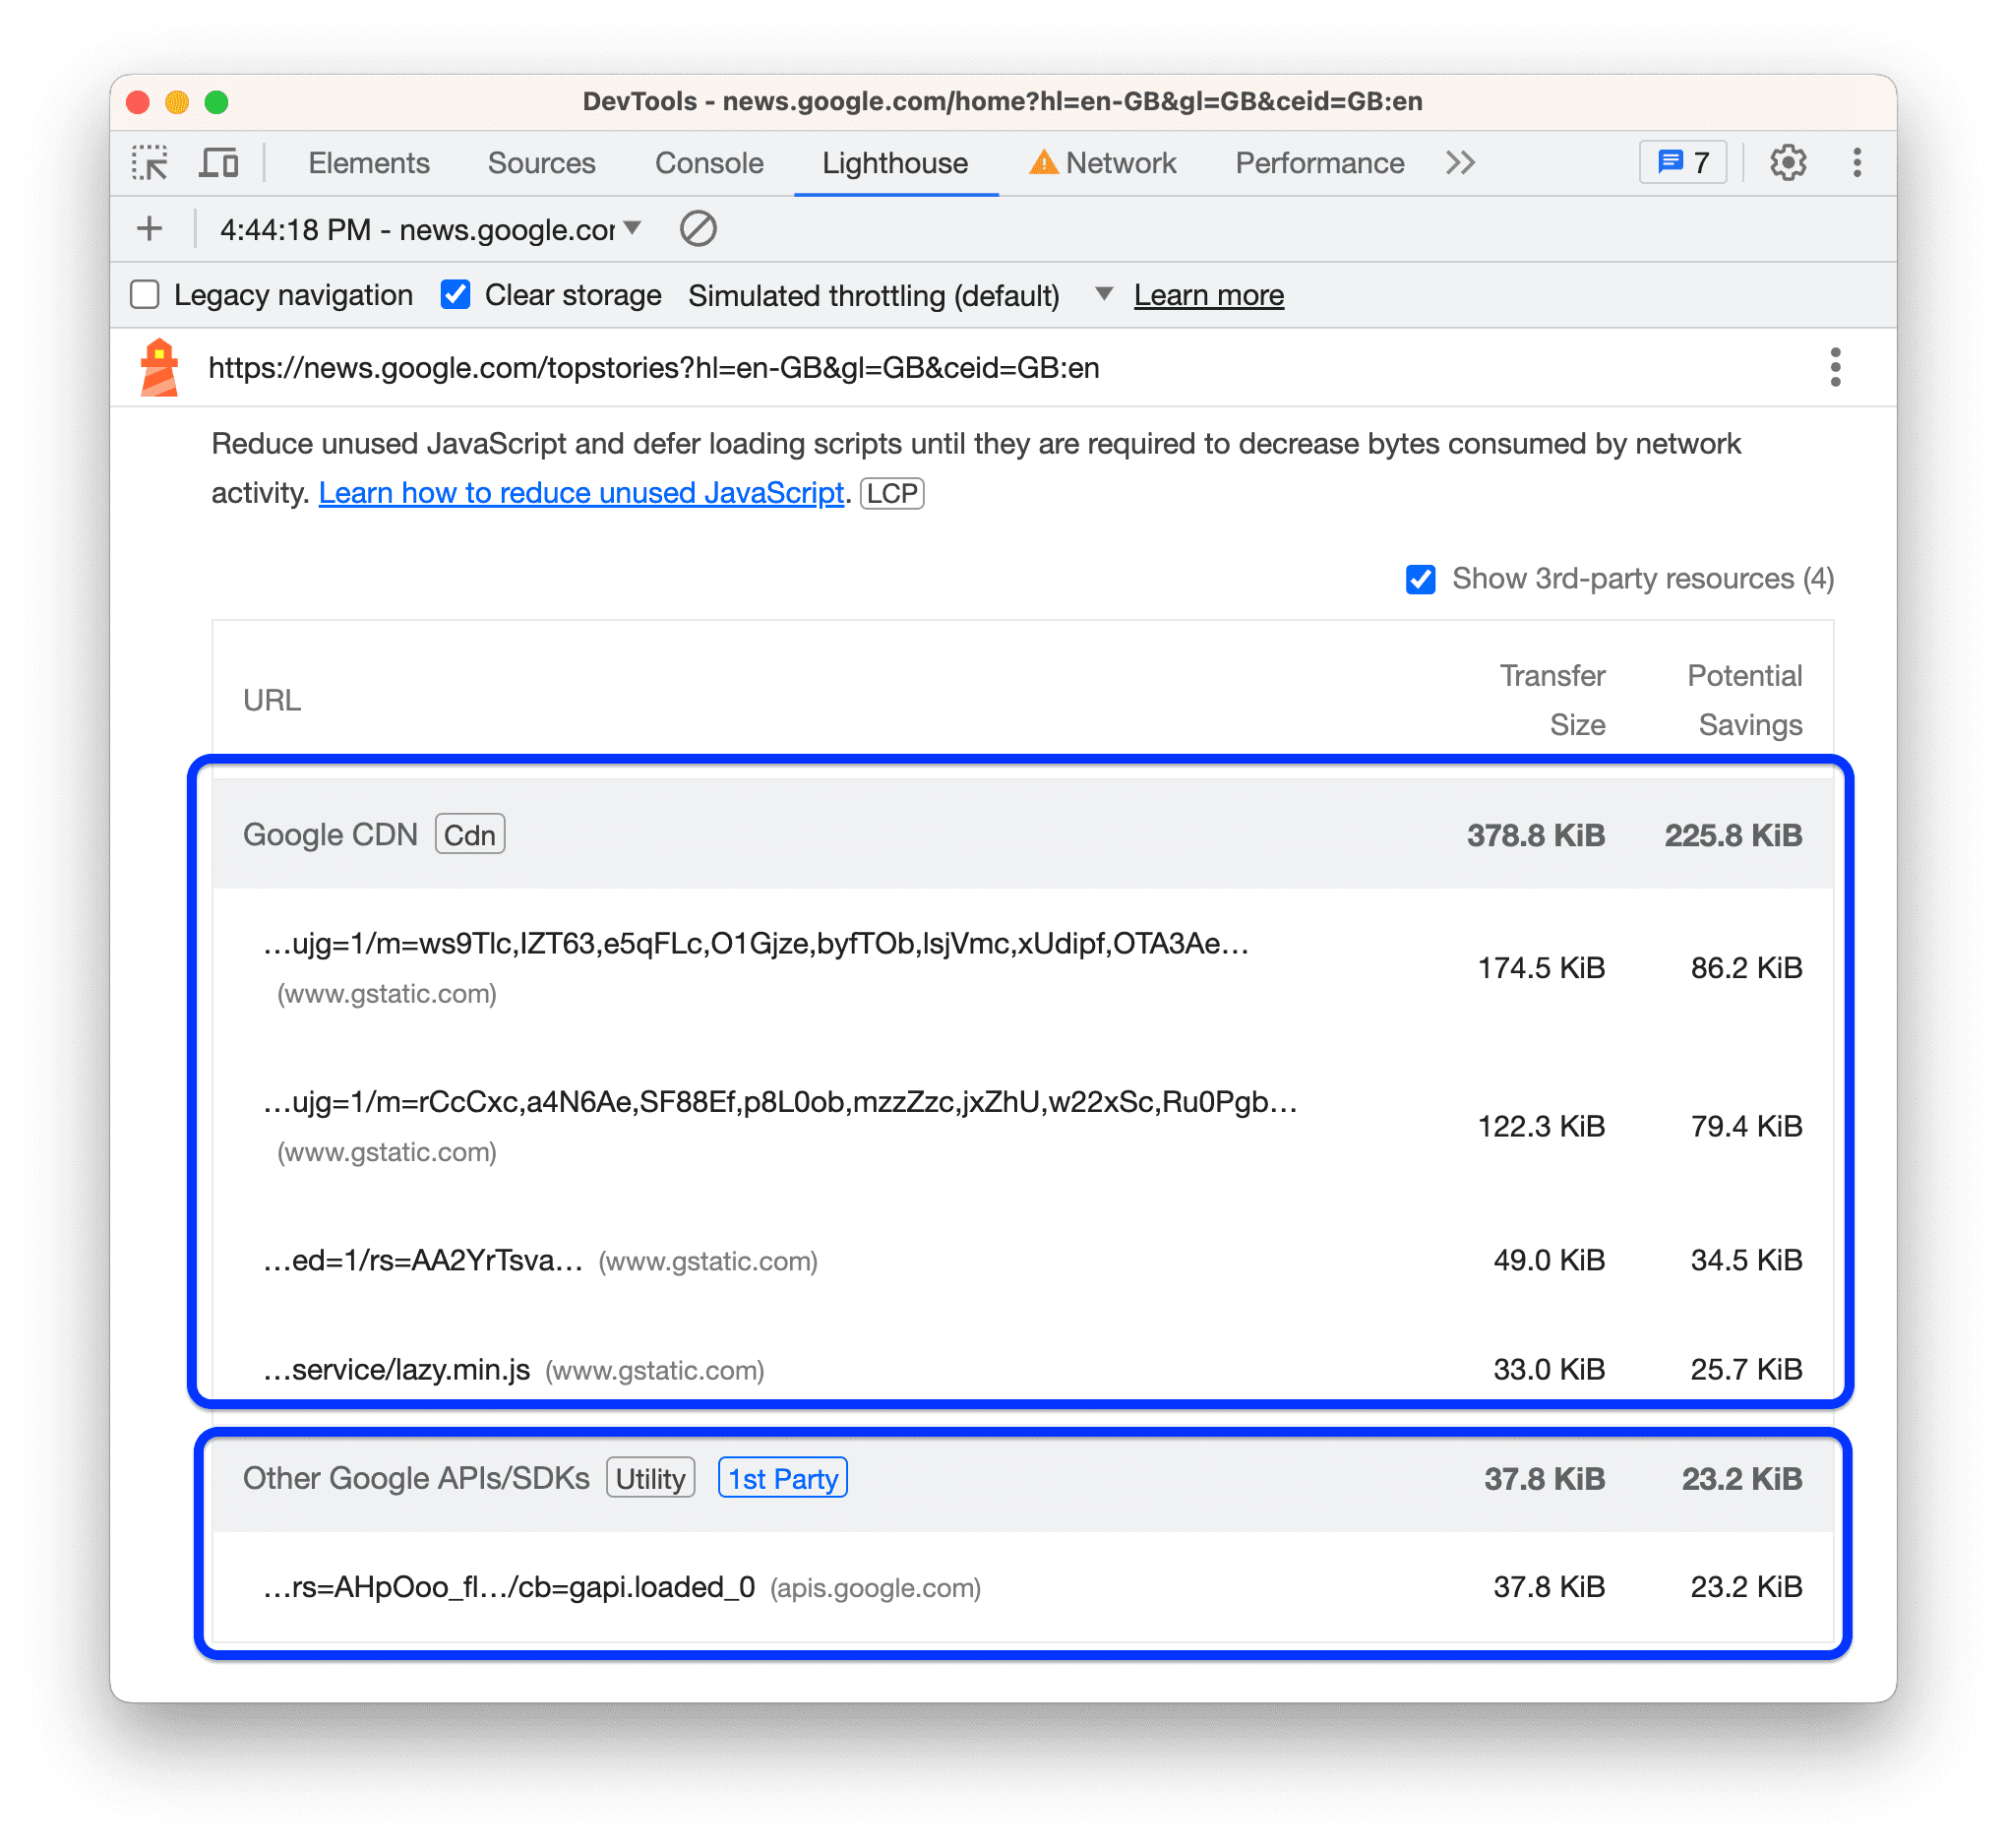
Lighthouse 10.1.1
The Lighthouse panel now runs Lighthouse 10.1.1, with a notable change introduced in 10.1.0. All audits that deal with URLs are now grouped by entity and aggregate numerical statistics such as size or duration. Popular third parties are also tagged with their category so it's easier to identify their purpose on the page.
To learn the basics of using the Lighthouse panel in DevTools, see Lighthouse: Optimize website speed.
Chromium issue: 772558.
Performance enhancements
performance.mark() shows timing on hover in Performance > Timings
The performance.mark() method now shows its timing when you hover over the corresponding mark in Performance > Timings. The timing here is a timestamp relative to the previous navigation event.

Chromium issue: 1426762.
profile() command populates Performance > Main
The profile() and profileEnd() commands in the Console now start and stop CPU profiling in the Main thread of the Performance panel.

Chromium issue: 1429191.
Warning for slow user interactions
User interactions longer than 200 milliseconds get an Interaction to Next Paint (INP) warning in the Performance > Summary tab.

Additionally, the ID of the interaction has been moved from the tooltip to Summary.
Chromium issues: 1432512, 1432509.
The Web Vitals track moved
The Performance panel has removed the following tracks:
- The Web Vitals track. Instead, see the relevant timings in the Timings track on hover.
- The Long Tasks subtrack. You can already find such tasks in the Main track shaded in red and with a red triangle.
Both the Web Vitals and Long Tasks tracks contained information duplicated elsewhere. They were also non-interactive compared to their more fully featured alternatives which provide more detailed information when clicked.

Additionally, the Experiences track was renamed to Layout Shifts to more accurately reflect its usage.
Learn more about Web Vitals.
JavaScript Profiler deprecation: Phase three
As early as Chrome 58, the DevTools team planned to eventually deprecate the JavaScript Profiler and have Node.js and Deno developers use the Performance panel for profiling JavaScript CPU performance.
DevTools version 114 starts phase three of the four-phase JavaScript Profiler deprecation. During this phase, the JavaScript Profiler panel is removed from DevTools but you can still temporarily enable it via Settings > Experiments and open it from the
three-dot menu.

To profile CPU performance, use the Performance panel.
Chromium issue: 1428026.
Miscellaneous highlights
These are some noteworthy fixes in this release:
- The Color Picker now detects HWB values that are out of gamut when clipped (1429271).
- The Sources panel:
- Enabled JSON syntax highlighting for source maps (1385374).
- Stopped showing "Source map detected" messages when you manually disable source maps (1423718).
- The Console now lets you evaluate incomplete JavaScript expressions with Ctrl + Enter and outputs syntax errors (1314700).
- The Breakpoint editing dialog now has a close button. Previously, you had to press Enter or unfocus the dialog (1412980).
Download the preview channels
Consider using the Chrome Canary, Dev, or Beta as your default development browser. These preview channels give you access to the latest DevTools features, let you test cutting-edge web platform APIs, and help you find issues on your site before your users do!
Get in touch with the Chrome DevTools team
Use the following options to discuss the new features, updates, or anything else related to DevTools.
- Submit feedback and feature requests to us at crbug.com.
- Report a DevTools issue using the More options > Help > Report a DevTools issue in DevTools.
- Tweet at @ChromeDevTools.
- Leave comments on What's new in DevTools YouTube videos or DevTools Tips YouTube videos.
What's new in DevTools
A list of everything that has been covered in the What's new in DevTools series.
- DevTools MCP server updates
- Improved trace sharing
- Support for @starting-style
- Editor widget for display: masonry
- Lighthouse 13
- Code suggestions from Gemini
- Enhancements for the DevTools MCP server
- Quicker access to AI assistance
- Debug the full performance trace with Gemini
- Toggle drawer orientation
- Google Developer Program
- Miscellaneous highlights
- Chrome DevTools (MCP) for your AI agent
- Debug the network dependency tree with Gemini
- Export your chats with Gemini
- Persisted track configuration in the Performance panel
- Filter IP protected network requests
- Elements > Layout tab adds masonry layout support
- Lighthouse 12.8.2
- Miscellaneous highlights
- Debug more insights with Gemini
- Emulate the 'Save-Data' header in 'Network conditions'
- See the Baseline status in a CSS property tooltip
- Override form factors in user agent client hints
- Lighthouse 12.8.0
- Miscellaneous highlights
- A more reliable and productive Chrome DevTools
- Upload images in AI assistance for styling
- Add request headers to the table in Network
- Check out the highlights from Google I/O 2025
- Miscellaneous highlights
- Performance panel improvements
- Preconnected origins in 'Network dependency tree' insight
- Server response and redirection times in 'Document request latency' insight
- Redirects in Summary of network requests
- Reduced noise in the performance trace
- Deprecated 'Disable JavaScript samples'
- Geolocation accuracy parameter in Sensors
- Elements panel improvements
- Debug complex CSS values easier
- @function support in Elements > Styles
- Network panel improvements
- has-request-header filter
- Direct Sockets in Isolated Web Apps
- Miscellaneous highlights
- Accessibility
- Google I/O 2025 edition
- Modify and save CSS changes to your workspace with Gemini
- Connect a workspace folder and save changes back to your source files
- Ask Gemini about performance insights
- Annotate performance findings with Gemini
- Add screenshots to your chats with Gemini
- New insights in the Performance panel
- Duplicated JavaScript
- Legacy JavaScript
- Speculations now support rule tags
- Lighthouse 12.6.0
- Miscellaneous highlights
- Accessibility
- Performance panel improvements
- New performance insights
- Click to highlight
- Server timings in Summary of network requests
- Filter cookies in 'Privacy and security'
- Sizes in kB units in tables across panels
- Autocomplete supports corner-shape and corner-*-shape in Elements > Styles
- Experimental: Highlighting issues with elements and attributes in DOM
- Lighthouse 12.5.0
- Miscellaneous highlights
- Performance panel improvements
- Origin and script links for profile and function calls in Performance
- LCP by phase field data support
- Network dependency tree insight
- Duration instead of total and self time in Summary
- Heaviest stack highlighting
- Improved empty states for various panels
- Accessibility tree view in Elements
- Lighthouse 12.4.0
- Miscellaneous highlights
- Privacy and security panel
- Performance panel improvements
- Calibrated CPU throttling presets
- Select different performance events in the same AI chat
- First- and third-party highlighting in Performance
- Field data in marker tooltips and insights
- Forced reflow insight
- 'Optimize DOM size' insight
- Extend the performance trace with console.timeStamp
- Elements panel improvements
- Real-time values of animated styles
- Support for :open pseudo-class and various pseudo-elements
- Copy all console messages
- Byte units in the Memory panel
- Miscellaneous highlights
- Persistent AI chat history
- Performance panel improvements
- Image delivery insight
- Classic and modern keyboard navigation
- Ignore irrelevant scripts in the flame chart
- Timeline marker and range highlighting on hover
- Recommended throttling settings
- Timings markers in an overlay
- Stack traces of JS calls in Summary
- Badge settings moved to menu in Elements
- New 'What's new' panel
- Lighthouse 12.3.0
- Miscellaneous highlights
- Debug network requests, source files, and performance traces with Gemini
- View AI chat history
- Manage extension storage in Application > Storage
- Performance improvements
- Interaction phases in live metrics
- Render blocking information in the Summary tab
- Support for scheduler.postTask events and their initiator arrows
- Animations panel and Elements > Styles tab improvements
- Jump from Elements > Styles to Animations
- Real-time updates in Computed tab
- Compute pressure emulation in Sensors
- JS objects with the same name grouped by source in the Memory panel
- A new look for settings
- Performance insights panel is deprecated and removed from DevTools
- Miscellaneous highlights
- Debug CSS with Gemini
- Control AI features in a dedicated settings tab
- Performance panel improvements
- Annotate and share performance findings
- Get performance insights right in the Performance panel
- Spot excessive layout shifts easier
- Spot the non-composited animations
- Hardware concurrency moves to Sensors
- Ignore anonymous scripts and focus on your code in stack traces
- Elements > Styles: Support for sideways-* writing modes for grid overlays and CSS-wide keywords
- Lighthouse audits for non-HTTP pages in timespan and snapshot modes
- Accessibility improvements
- Miscellaneous highlights
- Network panel improvements
- Network filters reimagined
- HAR exports now exclude sensitive data by default
- Elements panel improvements
- Autocomplete values for text-emphasis-* properties
- Scroll overflows marked with a badge
- Performance panel improvements
- Recommendations in live metrics
- Navigate breadcrumbs
- Memory panel improvements
- New 'Detached elements' profile
- Improved naming of plain JS objects
- Turn off dynamic theming
- Chrome Experiment: Process sharing
- Lighthouse 12.2.1
- Miscellaneous highlights
- Recorder supports export to Puppeteer for Firefox
- Performance panel improvements
- Live metrics observations
- Search requests in the Network track
- See stack traces of performance.mark and performance.measure calls
- Use test address data in the Autofill panel
- Elements panel improvements
- Force more states for specific elements
- Elements > Styles now autocompletes more grid properties
- Lighthouse 12.2.0
- Miscellaneous highlights
- Console insights by Gemini are going live in most European countries
- Performance panel updates
- Enhanced Network track
- Customize performance data with extensibility API
- Details in the Timings track
- Copy all listed requests in the Network panel
- Faster heap snapshots with named HTML tags and less clutter
- Open Animations panel to capture animations and edit @keyframes live
- Lighthouse 12.1.0
- Accessibility improvements
- Miscellaneous highlights
- Inspect CSS anchor positioning in the Elements panel
- Sources panel improvements
- Enhanced 'Never Pause Here'
- New scroll snap event listeners
- Network panel improvements
- Updated network throttling presets
- Service worker information in custom fields of the HAR format
- Send and receive WebSocket events in the Performance panel
- Miscellaneous highlights
- Performance panel improvements
- Move and hide tracks with updated track configuration mode
- Ignore scripts in the flame chart
- Throttle down the CPU by 20 times
- Performance insights panel will be deprecated