
Console insights by Gemini are going live in most European countries
This version brings support of console insights by Gemini to most European countries.
List of newly supported European countries
Austria, Belgium, Bulgaria, Switzerland, Cyprus, Czechia, Germany, Denmark, Estonia, Spain, Finland, France, UK, Greece, Croatia, Hungary, Ireland, Iceland, Italy, Liechtenstein, Lithuania, Luxembourg, Latvia, Malta, the Netherlands, Norway, Poland, Portugal, Romania, Sweden, Slovenia, Slovakia.
If you are in one of those countries, you can now ask Gemini to provide insights right in the Console, so you can better understand errors and warnings.

Performance panel updates
This update brings a few improvements to the Performance panel.
Enhanced Network track
The Network track in the Performance panel has been enhanced to show critical information upfront, for example, more detailed duration and network initiator tree, and to provide greater clarity on the visual cues and colors. So, you don't have to switch between the Network panel and the Performance > Summary tab anymore. In addition, if you still need to switch to the Network panel, we've made it easier and faster for you.
The Network track now does the following:
- Shows a color legend for request types.
- Marks render-blocking requests with red triangles in the upper right corner.
- Shows request initiator upon selection with an arrow. This helps you understand the tree of network initiators that was previously only available in the Network panel.
- On hover, a reworked tooltip now shows structured timing information, including render-blocking status and changes in priority, if any.
- The Summary tab now also shows a breakdown of timings in a column on the right.

Additionally, you can now right-click the request in the track or its URL in the Summary tab and select Reveal in Network panel from the drop-down menu. DevTools will take you to the Network panel and highlight the request you are looking for in the table.

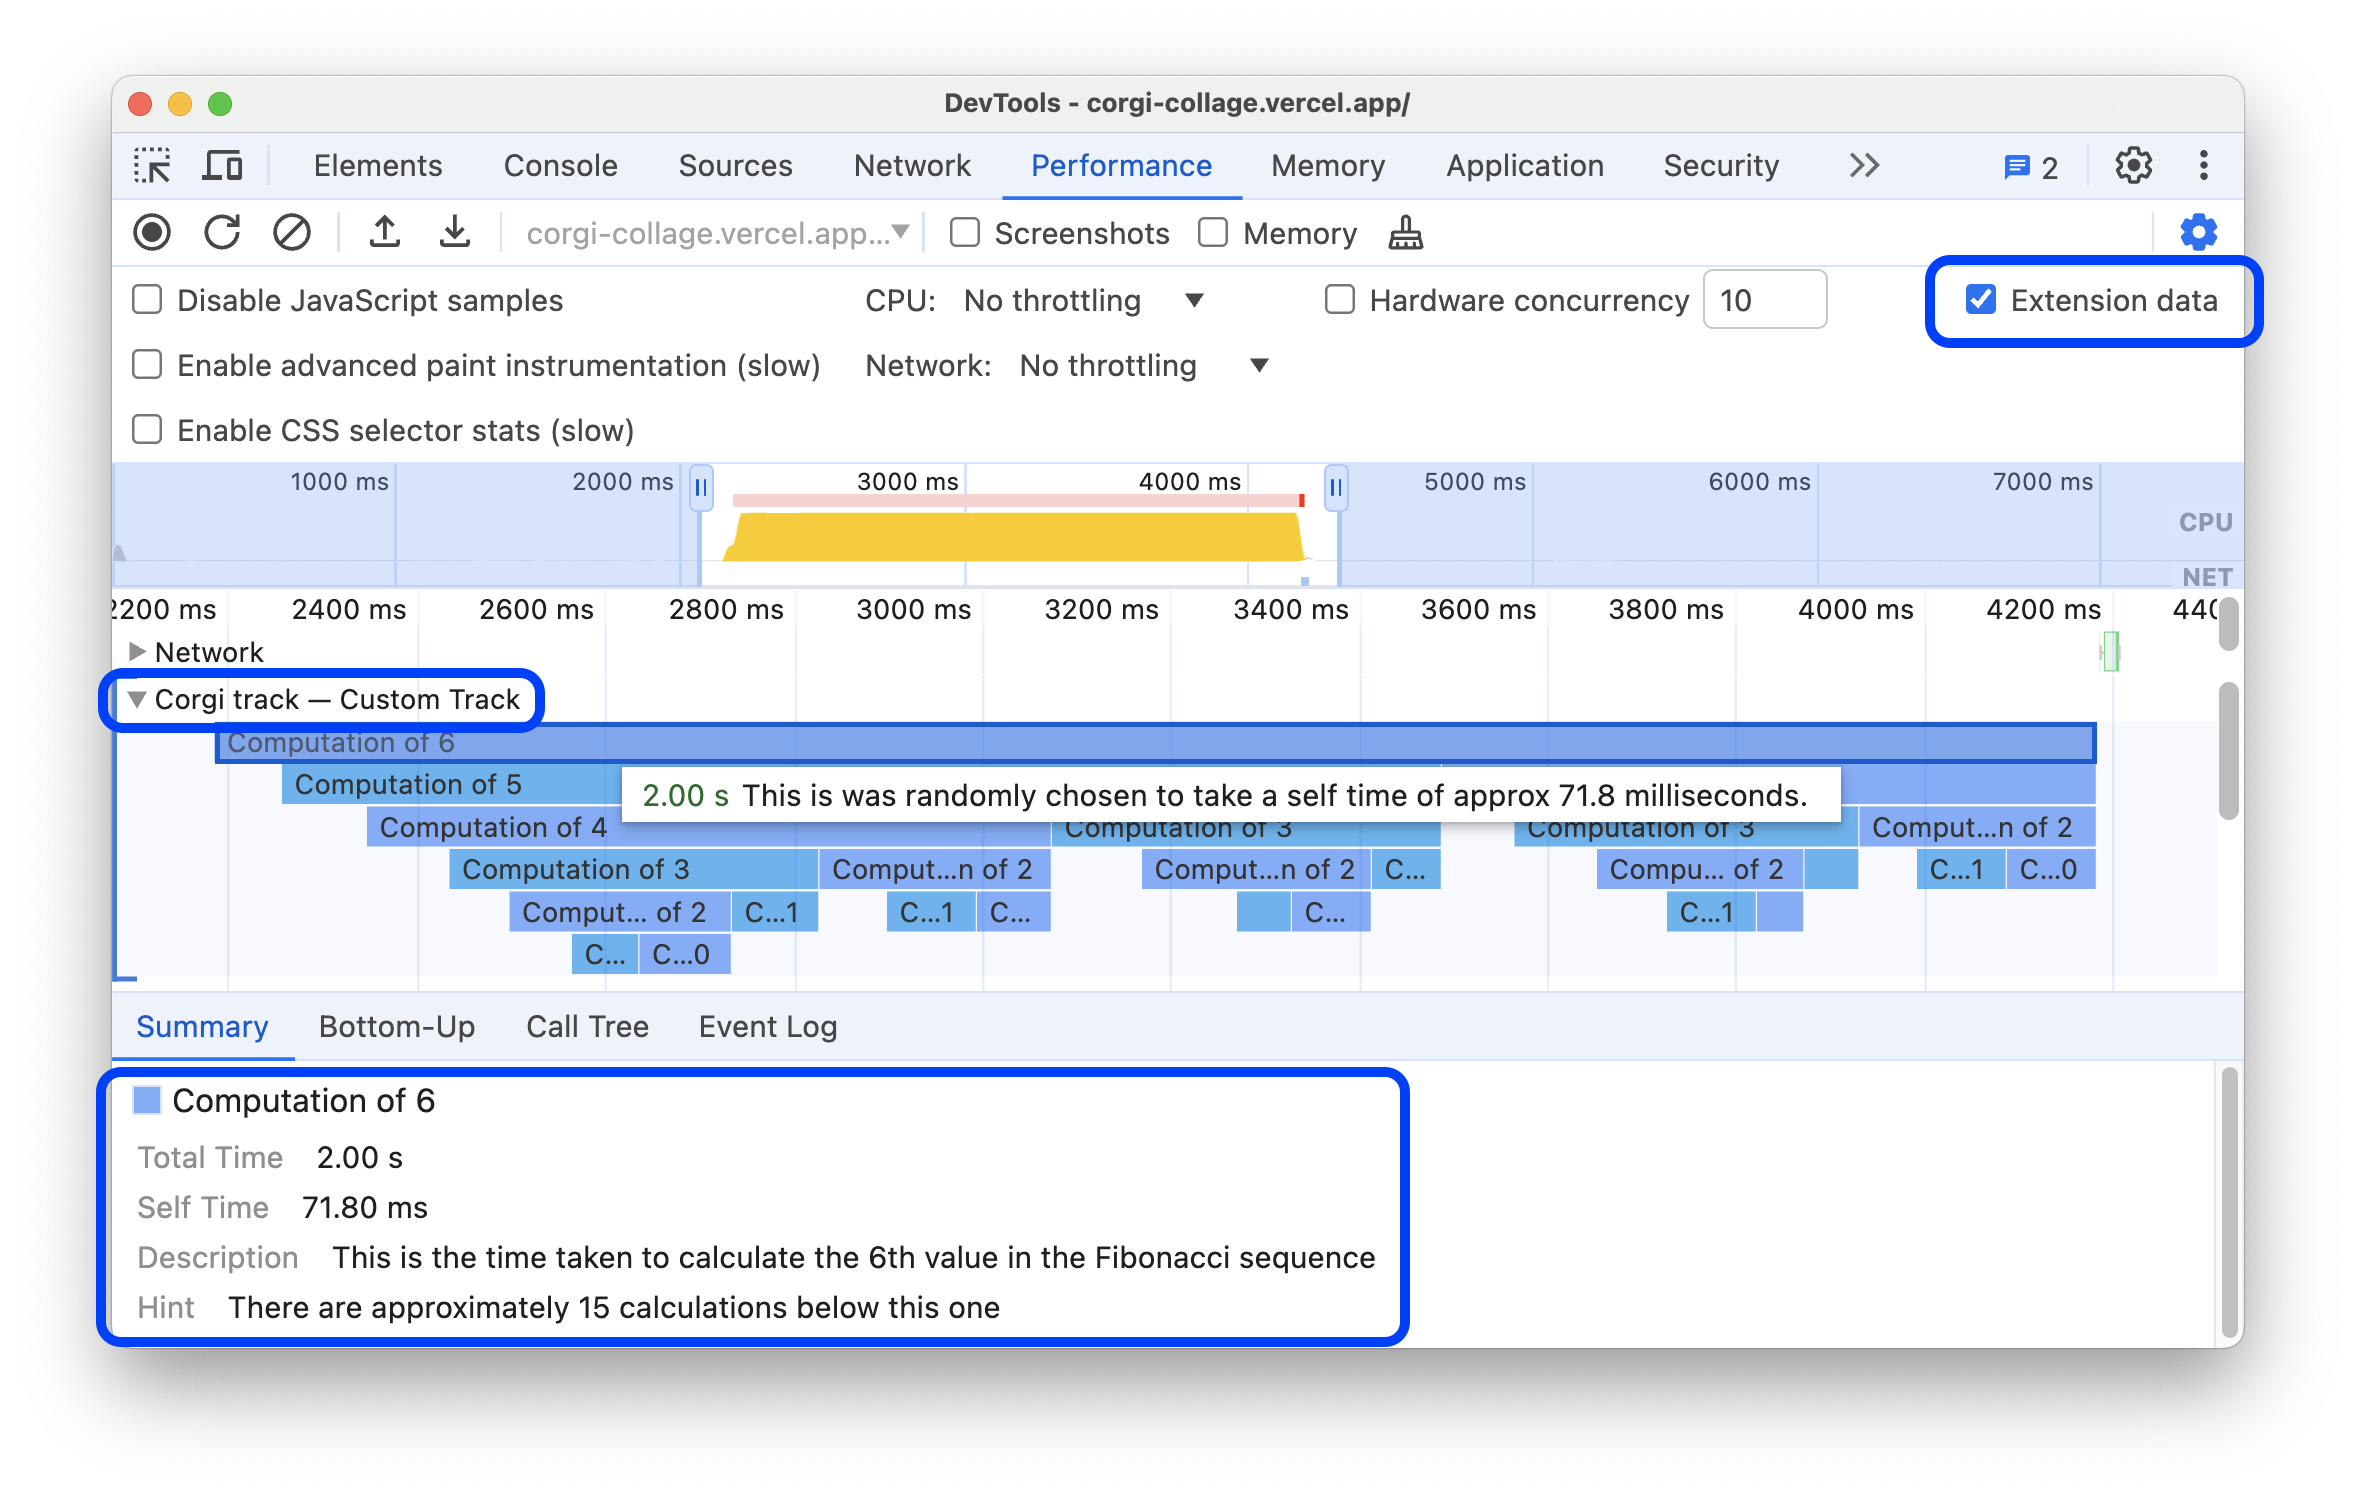
Customize performance data with extensibility API
This version brings support for extension data to the Performance panel. You can now add custom tracks with events and tooltip descriptions to the performance trace, details to the Summary tab, and more. This feature may be useful for developers of frameworks, libraries, and complex applications with custom instrumentation.
See an example of a custom track on this demo page. In Performance > Capture settings, turn on Extension data. Start a performance recording, click Add new Corgi on the demo page, then stop the recording. You'll see a custom track in the trace that contains events with custom tooltips and details in the Summary tab.
In short, to extend performance data, pass a specific structure to the measureOption.detail or markOption.detail parameters of performance.measure() or performance.mark() API calls.
Details in the Timings track
If you are a web developer who uses the User Timing part of Performance API to add entries to the Timings track, you can now see your arbitrary details in the Summary tab for mark and measure events and their timestamps.

Chromium issue: 345418915.
Copy all listed requests in the Network panel
Instead of copying the entire network log, the Network panel now lets you apply filters and copy only the listed requests.

Faster heap snapshots with named HTML tags and less clutter
Heap snapshots in the Memory panel get even faster, now have objects grouped by named HTML tags, better match JavaScript language semantics by showing fewer internal objects, and always include numeric values.

The performance of Include numerical values in capture setting has been sped up, turned on by default, and removed from the Memory panel.
To manually include internal objects into the snapshot, turn on, first Settings > Experiments > Show option to expose internals in heap snapshots, then turn on Expose internals (...) in the Memory panel.
Chromium issues: 41490040, 343341610, 42203857.
Open Animations panel to capture animations and edit @keyframes live
The Animations panel now does the following:
- Captures animations that are already in progress when you open the panel, so you don't have to refresh the page to capture animations.
- Supports live editing of
@keyframes. In other words, updates the captured animation as you edit@keyframessection in Elements > Styles.
See both features in action in the following video.
Chromium issue: 352718055.
Lighthouse 12.1.0
The Lighthouse panel now runs Lighthouse 12.1.0.
This update brings a number of changes, including the removal of the old First Meaningful Paint (FMP) metric in favor of Largest Contentful Paint (LCP). See the full list of changes.
To learn the basics of using the Lighthouse panel in DevTools, see Lighthouse: Optimize website speed.
Chromium issue: 772558.
Accessibility
This version has the following accessibility improvements:
- Pressing Tab after auto-completion in the edit field of live expressions moves the focus to the next focus point. Previously, it would indent the text.
- Clicking a resizer puts focus on it, so you can move it with right and left arrow keys.
- A screen reader now announces the Add watch expression edit field in Sources and Delete watch expression is now clearly visible when navigating with a keyboard.
Chromium issues: 349939551, 343942719, 349334243, 349428374.
Miscellaneous highlights
These are some noteworthy fixes and improvements in this release:
- Performance:
- Elements > Styles:
- Application:
Download the preview channels
Consider using the Chrome Canary, Dev, or Beta as your default development browser. These preview channels give you access to the latest DevTools features, let you test cutting-edge web platform APIs, and help you find issues on your site before your users do!
Get in touch with the Chrome DevTools team
Use the following options to discuss the new features, updates, or anything else related to DevTools.
- Submit feedback and feature requests to us at crbug.com.
- Report a DevTools issue using the More options > Help > Report a DevTools issue in DevTools.
- Tweet at @ChromeDevTools.
- Leave comments on What's new in DevTools YouTube videos or DevTools Tips YouTube videos.
What's new in DevTools
A list of everything that has been covered in the What's new in DevTools series.
- DevTools MCP server updates
- Improved trace sharing
- Support for @starting-style
- Editor widget for display: masonry
- Lighthouse 13
- Code suggestions from Gemini
- Enhancements for the DevTools MCP server
- Quicker access to AI assistance
- Debug the full performance trace with Gemini
- Toggle drawer orientation
- Google Developer Program
- Miscellaneous highlights
- Chrome DevTools (MCP) for your AI agent
- Debug the network dependency tree with Gemini
- Export your chats with Gemini
- Persisted track configuration in the Performance panel
- Filter IP protected network requests
- Elements > Layout tab adds masonry layout support
- Lighthouse 12.8.2
- Miscellaneous highlights
- Debug more insights with Gemini
- Emulate the 'Save-Data' header in 'Network conditions'
- See the Baseline status in a CSS property tooltip
- Override form factors in user agent client hints
- Lighthouse 12.8.0
- Miscellaneous highlights
- A more reliable and productive Chrome DevTools
- Upload images in AI assistance for styling
- Add request headers to the table in Network
- Check out the highlights from Google I/O 2025
- Miscellaneous highlights
- Performance panel improvements
- Preconnected origins in 'Network dependency tree' insight
- Server response and redirection times in 'Document request latency' insight
- Redirects in Summary of network requests
- Reduced noise in the performance trace
- Deprecated 'Disable JavaScript samples'
- Geolocation accuracy parameter in Sensors
- Elements panel improvements
- Debug complex CSS values easier
- @function support in Elements > Styles
- Network panel improvements
- has-request-header filter
- Direct Sockets in Isolated Web Apps
- Miscellaneous highlights
- Accessibility
- Google I/O 2025 edition
- Modify and save CSS changes to your workspace with Gemini
- Connect a workspace folder and save changes back to your source files
- Ask Gemini about performance insights
- Annotate performance findings with Gemini
- Add screenshots to your chats with Gemini
- New insights in the Performance panel
- Duplicated JavaScript
- Legacy JavaScript
- Speculations now support rule tags
- Lighthouse 12.6.0
- Miscellaneous highlights
- Accessibility
- Performance panel improvements
- New performance insights
- Click to highlight
- Server timings in Summary of network requests
- Filter cookies in 'Privacy and security'
- Sizes in kB units in tables across panels
- Autocomplete supports corner-shape and corner-*-shape in Elements > Styles
- Experimental: Highlighting issues with elements and attributes in DOM
- Lighthouse 12.5.0
- Miscellaneous highlights
- Performance panel improvements
- Origin and script links for profile and function calls in Performance
- LCP by phase field data support
- Network dependency tree insight
- Duration instead of total and self time in Summary
- Heaviest stack highlighting
- Improved empty states for various panels
- Accessibility tree view in Elements
- Lighthouse 12.4.0
- Miscellaneous highlights
- Privacy and security panel
- Performance panel improvements
- Calibrated CPU throttling presets
- Select different performance events in the same AI chat
- First- and third-party highlighting in Performance
- Field data in marker tooltips and insights
- Forced reflow insight
- 'Optimize DOM size' insight
- Extend the performance trace with console.timeStamp
- Elements panel improvements
- Real-time values of animated styles
- Support for :open pseudo-class and various pseudo-elements
- Copy all console messages
- Byte units in the Memory panel
- Miscellaneous highlights
- Persistent AI chat history
- Performance panel improvements
- Image delivery insight
- Classic and modern keyboard navigation
- Ignore irrelevant scripts in the flame chart
- Timeline marker and range highlighting on hover
- Recommended throttling settings
- Timings markers in an overlay
- Stack traces of JS calls in Summary
- Badge settings moved to menu in Elements
- New 'What's new' panel
- Lighthouse 12.3.0
- Miscellaneous highlights
- Debug network requests, source files, and performance traces with Gemini
- View AI chat history
- Manage extension storage in Application > Storage
- Performance improvements
- Interaction phases in live metrics
- Render blocking information in the Summary tab
- Support for scheduler.postTask events and their initiator arrows
- Animations panel and Elements > Styles tab improvements
- Jump from Elements > Styles to Animations
- Real-time updates in Computed tab
- Compute pressure emulation in Sensors
- JS objects with the same name grouped by source in the Memory panel
- A new look for settings
- Performance insights panel is deprecated and removed from DevTools
- Miscellaneous highlights
- Debug CSS with Gemini
- Control AI features in a dedicated settings tab
- Performance panel improvements
- Annotate and share performance findings
- Get performance insights right in the Performance panel
- Spot excessive layout shifts easier
- Spot the non-composited animations
- Hardware concurrency moves to Sensors
- Ignore anonymous scripts and focus on your code in stack traces
- Elements > Styles: Support for sideways-* writing modes for grid overlays and CSS-wide keywords
- Lighthouse audits for non-HTTP pages in timespan and snapshot modes
- Accessibility improvements
- Miscellaneous highlights
- Network panel improvements
- Network filters reimagined
- HAR exports now exclude sensitive data by default
- Elements panel improvements
- Autocomplete values for text-emphasis-* properties
- Scroll overflows marked with a badge
- Performance panel improvements
- Recommendations in live metrics
- Navigate breadcrumbs
- Memory panel improvements
- New 'Detached elements' profile
- Improved naming of plain JS objects
- Turn off dynamic theming
- Chrome Experiment: Process sharing
- Lighthouse 12.2.1
- Miscellaneous highlights
- Recorder supports export to Puppeteer for Firefox
- Performance panel improvements
- Live metrics observations
- Search requests in the Network track
- See stack traces of performance.mark and performance.measure calls
- Use test address data in the Autofill panel
- Elements panel improvements
- Force more states for specific elements
- Elements > Styles now autocompletes more grid properties
- Lighthouse 12.2.0
- Miscellaneous highlights
- Console insights by Gemini are going live in most European countries
- Performance panel updates
- Enhanced Network track
- Customize performance data with extensibility API
- Details in the Timings track
- Copy all listed requests in the Network panel
- Faster heap snapshots with named HTML tags and less clutter
- Open Animations panel to capture animations and edit @keyframes live
- Lighthouse 12.1.0
- Accessibility improvements
- Miscellaneous highlights
- Inspect CSS anchor positioning in the Elements panel
- Sources panel improvements
- Enhanced 'Never Pause Here'
- New scroll snap event listeners
- Network panel improvements
- Updated network throttling presets
- Service worker information in custom fields of the HAR format
- Send and receive WebSocket events in the Performance panel
- Miscellaneous highlights
- Performance panel improvements
- Move and hide tracks with updated track configuration mode
- Ignore scripts in the flame chart
- Throttle down the CPU by 20 times
- Performance insights panel will be deprecated
- Find excessive memory usage with new filters in heap snapshots
- Inspect storage buckets in Application > Storage
- Disable self-XSS warnings with a command-line flag
- Lighthouse 12.0.0
- Miscellaneous highlights
- Understand errors and warnings in the Console better with Gemini
- @position-try rules support in Elements > Styles
- Sources panel improvements
- Configure automatic pretty-printing and bracket closing
- Handled rejected promises are recognized as caught
- Error causes in the Console
- Network panel improvements
- Inspect Early Hints headers
- Hide the Waterfall column
- Performance panel improvements
- Capture CSS selector statistics
- Change order and hide tracks
- Ignore retainers in the Memory panel
- Lighthouse 11.7.1
- Miscellaneous highlights
- New Autofill panel
- Enhanced network throttling for WebRTC
- Scroll-driven animations support in the Animations panel
- Improved CSS nesting support in Elements > Styles
- Enhanced Performance panel
- Hide functions and their children in the flame chart
- Arrows from selected initiators to events they initiated
- Lighthouse 11.6.0
- Tooltips for special categories in Memory > Heap snapshots
- Application > Storage updates
- Bytes used for shared storage
- Web SQL is fully deprecated
- Coverage panel improvements
- The Layers panel might be deprecated
- JavaScript Profiler deprecation: Phase four, final
- Miscellaneous highlights
- Find the Easter egg
- Elements panel updates
- Emulate a focused page in Elements > Styles
- Color Picker, Angle Clock, and Easing Editor in
var()fallbacks - CSS length tool is deprecated
- Popover for the selected search result in the Performance > Main track
- Network panel updates
- Clear button and search filter in the Network > EventStream tab
- Tooltips with exemption reasons for third-party cookies in Network > Cookies
- Enable and disable all breakpoints in Sources
- View loaded scripts in DevTools for Node.js
- Lighthouse 11.5.0
- Accessibility improvements
- Miscellaneous highlights
- The official collection of Recorder extensions is live
- Network improvements
- Failure reason in the Status column
- Improved Copy submenu
- Performance improvements
- Breadcrumbs in the Timeline
- Event initiators in the Main track
- JavaScript VM instance selector menu for Node.js DevTools
- New shortcut and command in Sources
- Elements improvements
- The ::view-transition pseudo-element is now editable in Styles
- The align-content property support for block containers
- Posture support for emulated foldable devices
- Dynamic theming
- Third-party cookies phaseout warnings in the Network and Application panels
- Lighthouse 11.4.0
- Accessibility improvements
- Miscellaneous highlights