
Privacy and security panel
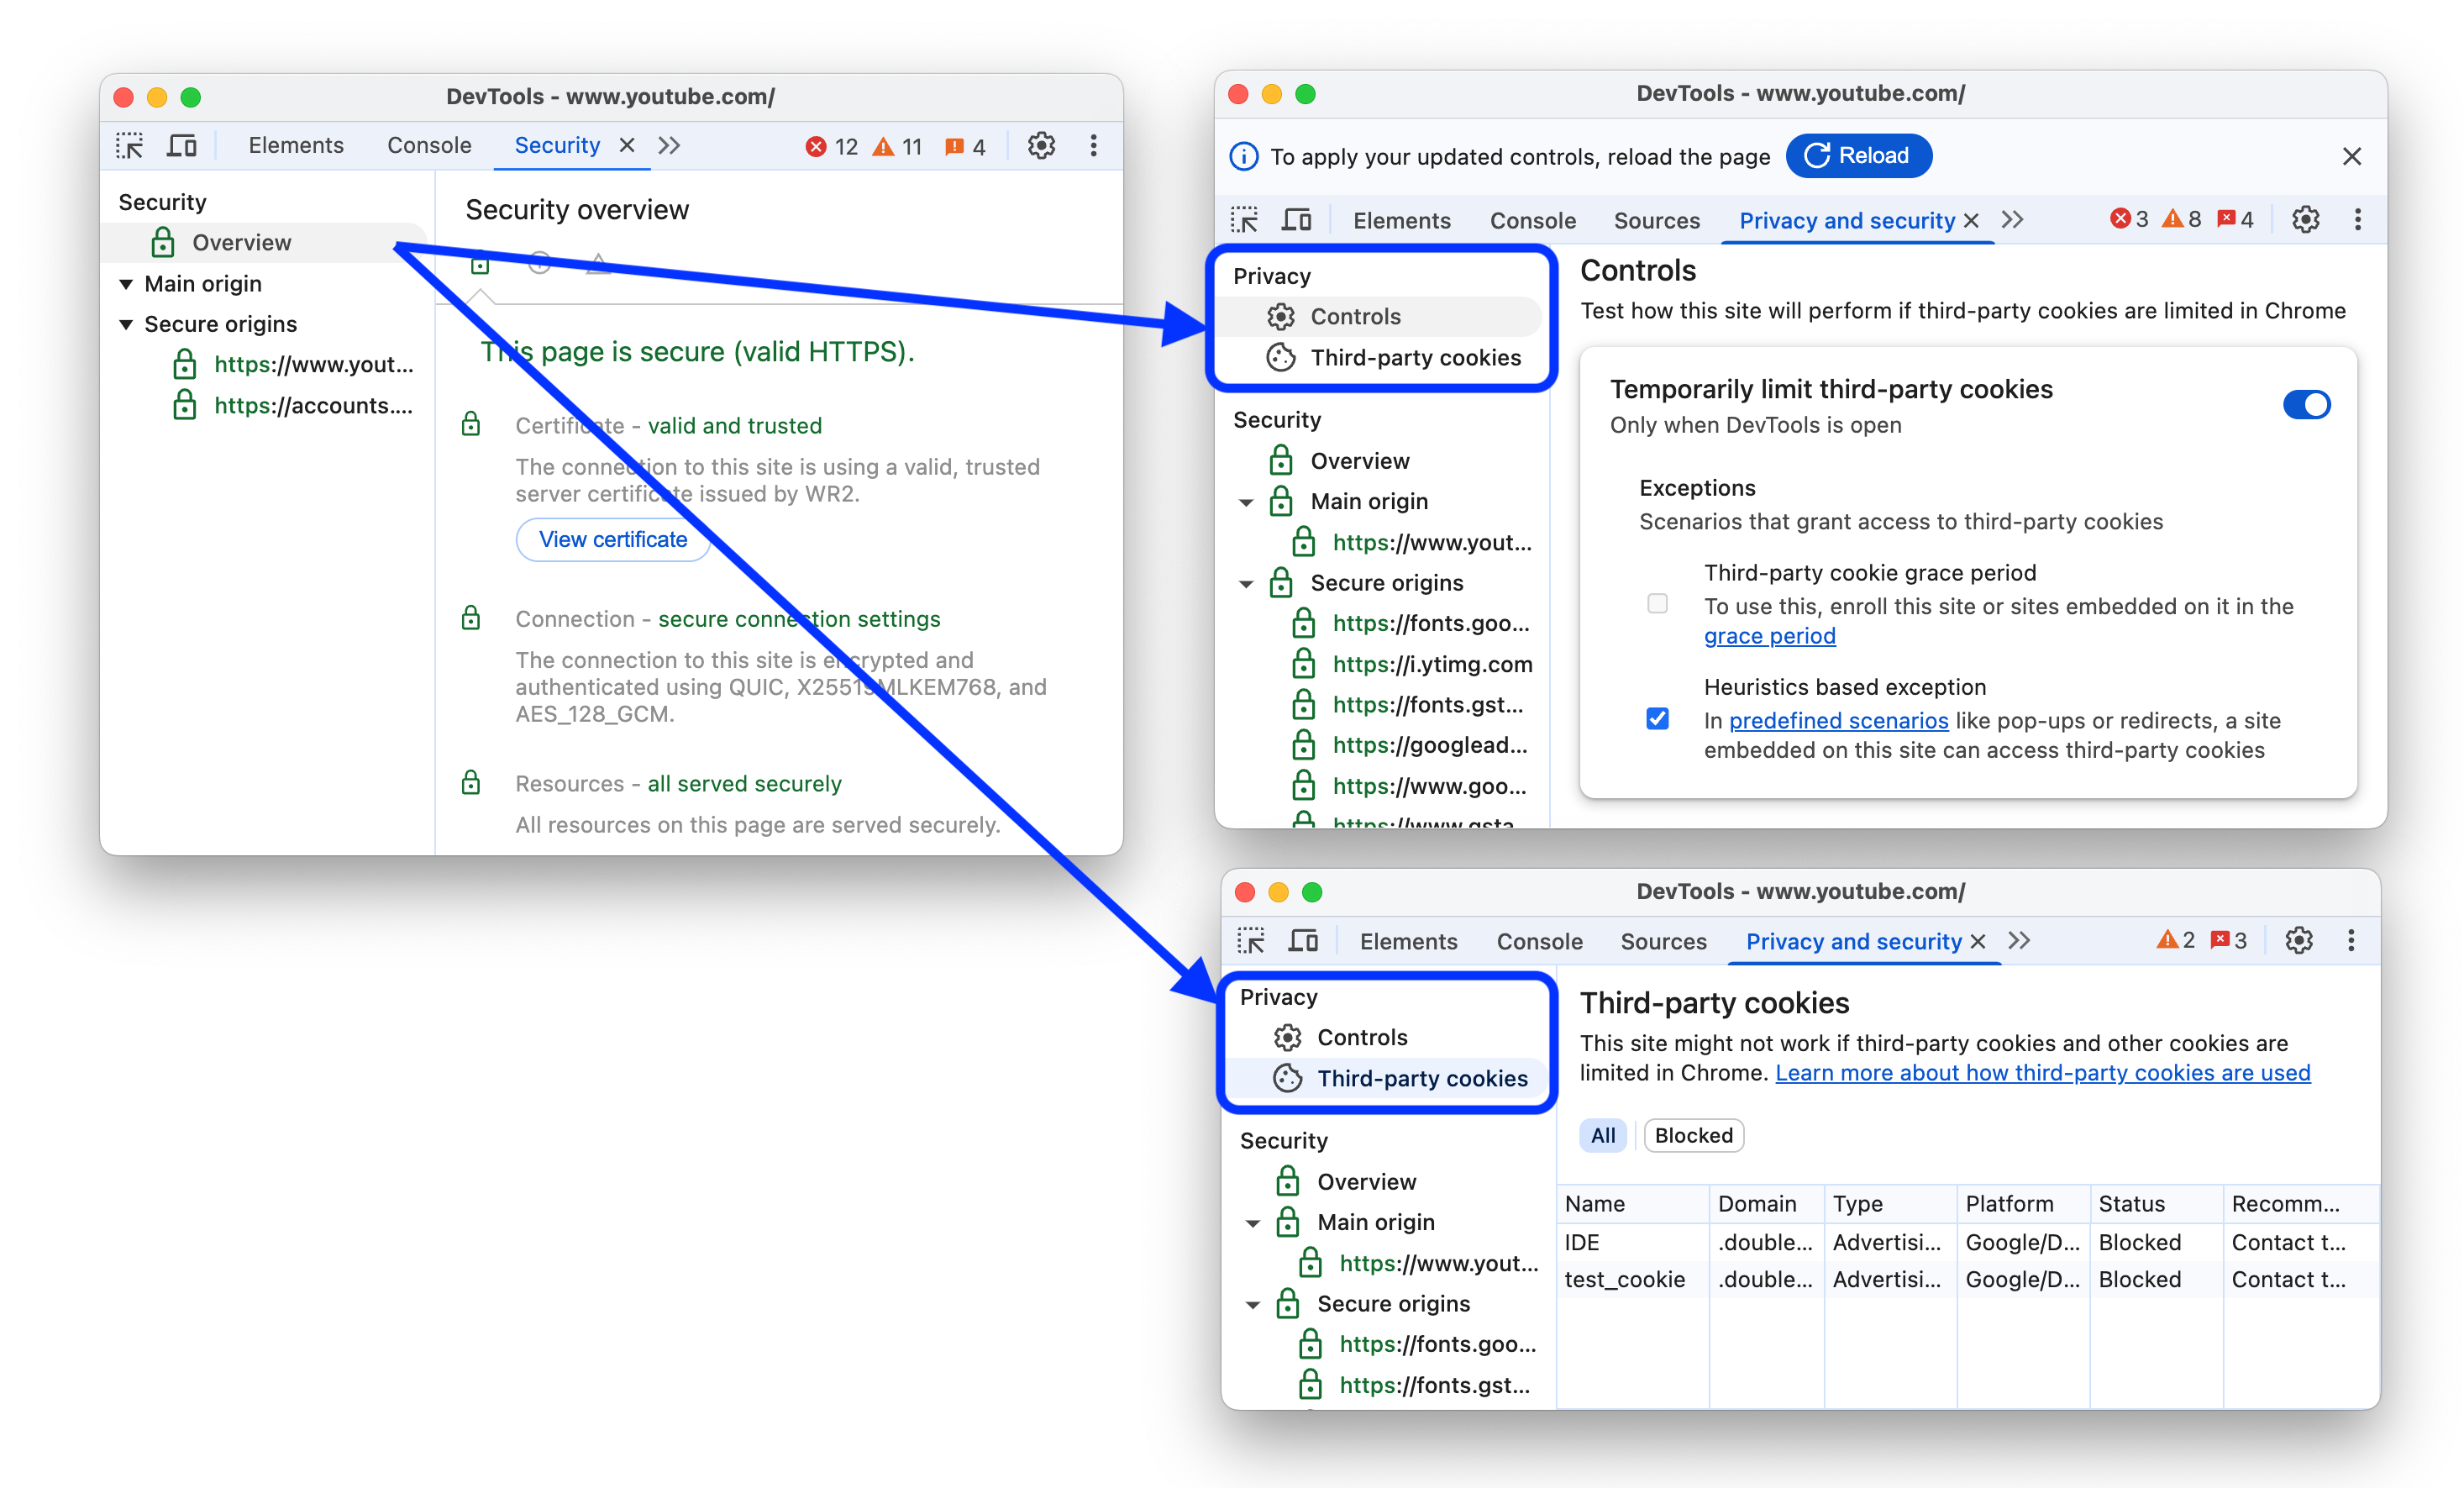
The old Security panel evolved into the Privacy and security panel and gets a new privacy-dedicated section. In this section, you can:
- While DevTools is open, temporarily limit third-party cookies with or without exceptions and test how a website behaves.
- See a table with information on third-party cookies, including whether they were blocked or exempted by the temporary limit mode, and what type of cookies may be impacted.
Chromium issue: 352364594.
Performance panel improvements
This version brings a number of improvements to the Performance panel.
Calibrated CPU throttling presets
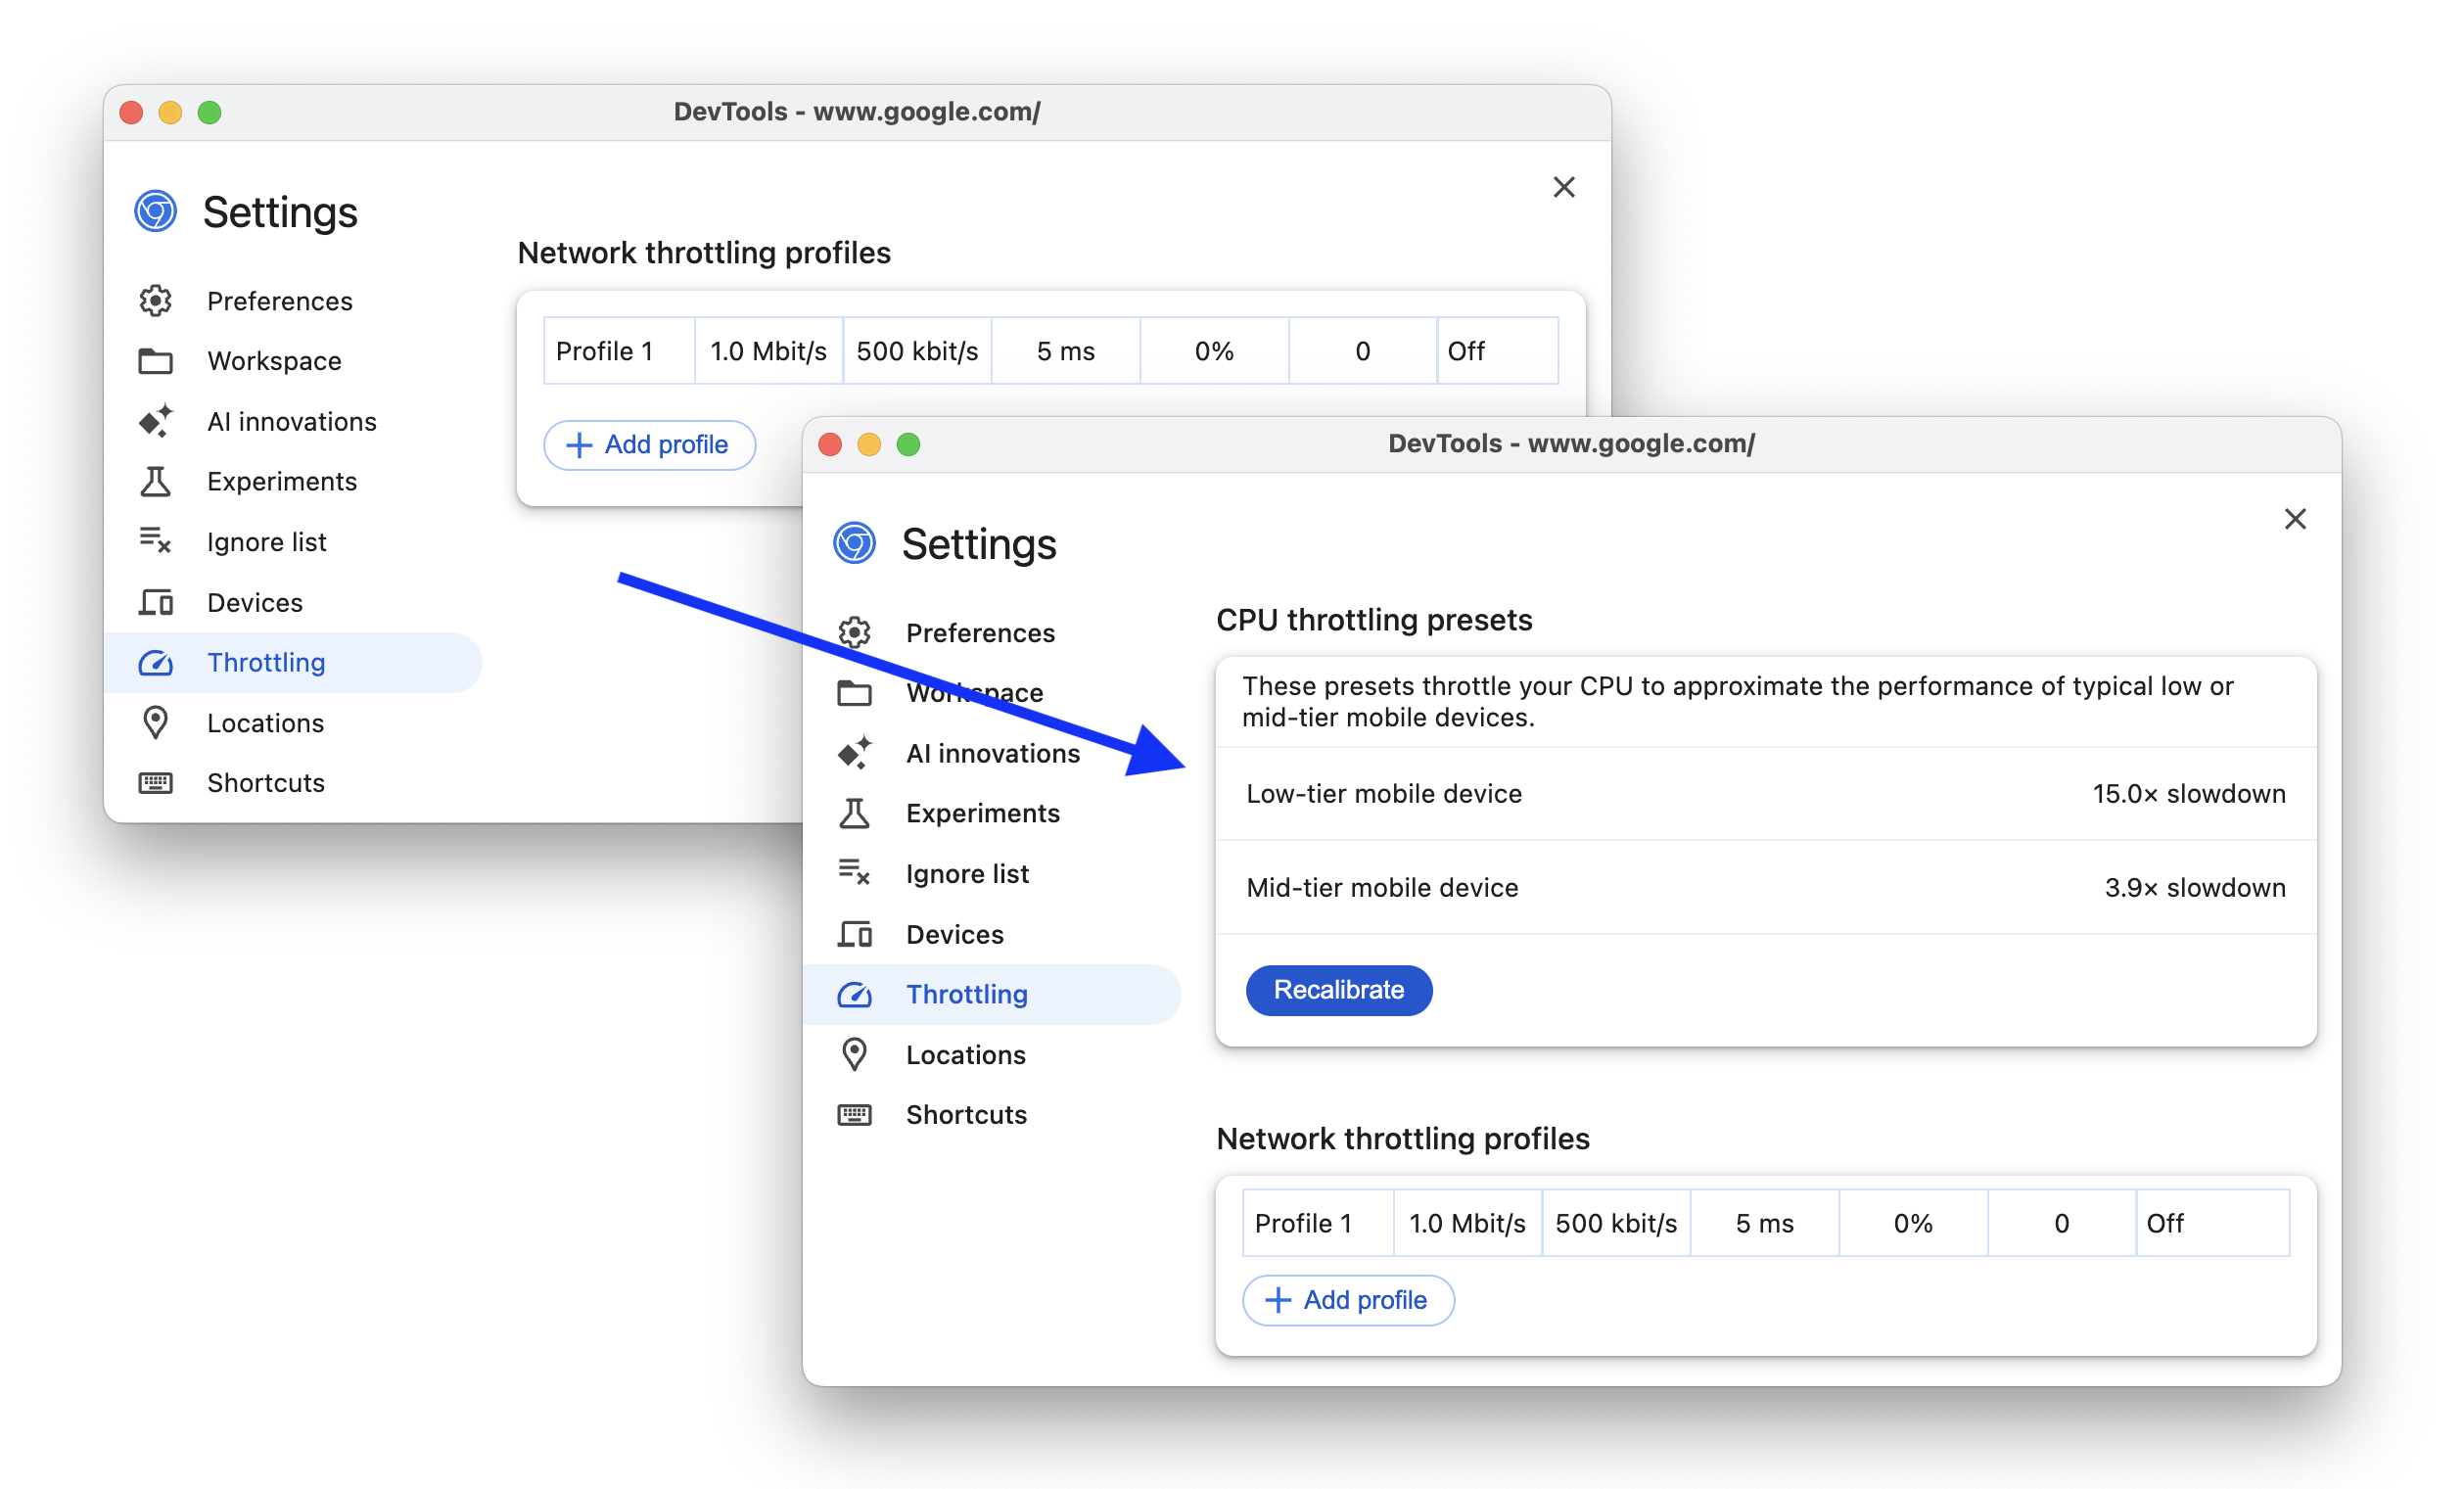
You can now automatically calibrate and get two additional CPU throttling presets that more accurately approximate low- and mid-tier mobile devices.
In Performance > CPU throttling drop-down menu, select Calibrate..., then in Settings, click Calibrate, Continue, and wait for DevTools to calculate slowdown rates for your device. You can find the calibrated throttling options back in the Performance > CPU throttling drop-down menu.
Select different performance events in the same AI chat
The AI assistance panel now lets you change the selected event in the performance trace in the same chat. In other words, you don't have to start a new chat to talk about a different event.
First- and third-party highlighting in Performance
The Performance panel gets a new table in the Summary tab that lets you distinguish between first-, third-party, and extension data.
Hover over entries in the table to see the relevant events highlighted in the performance trace. Check Dim 3rd parties to focus only on the first-party data.
Additionally, click icon next to a highlighted entry in the table to go to the Bottom-up tab grouped by third parties.
Field data in marker tooltips and insights
If you have field data turned on, you can now see it in metric marker tooltips and the Insights tab.

Chromium issue: 368135130.
'Forced reflow' insight
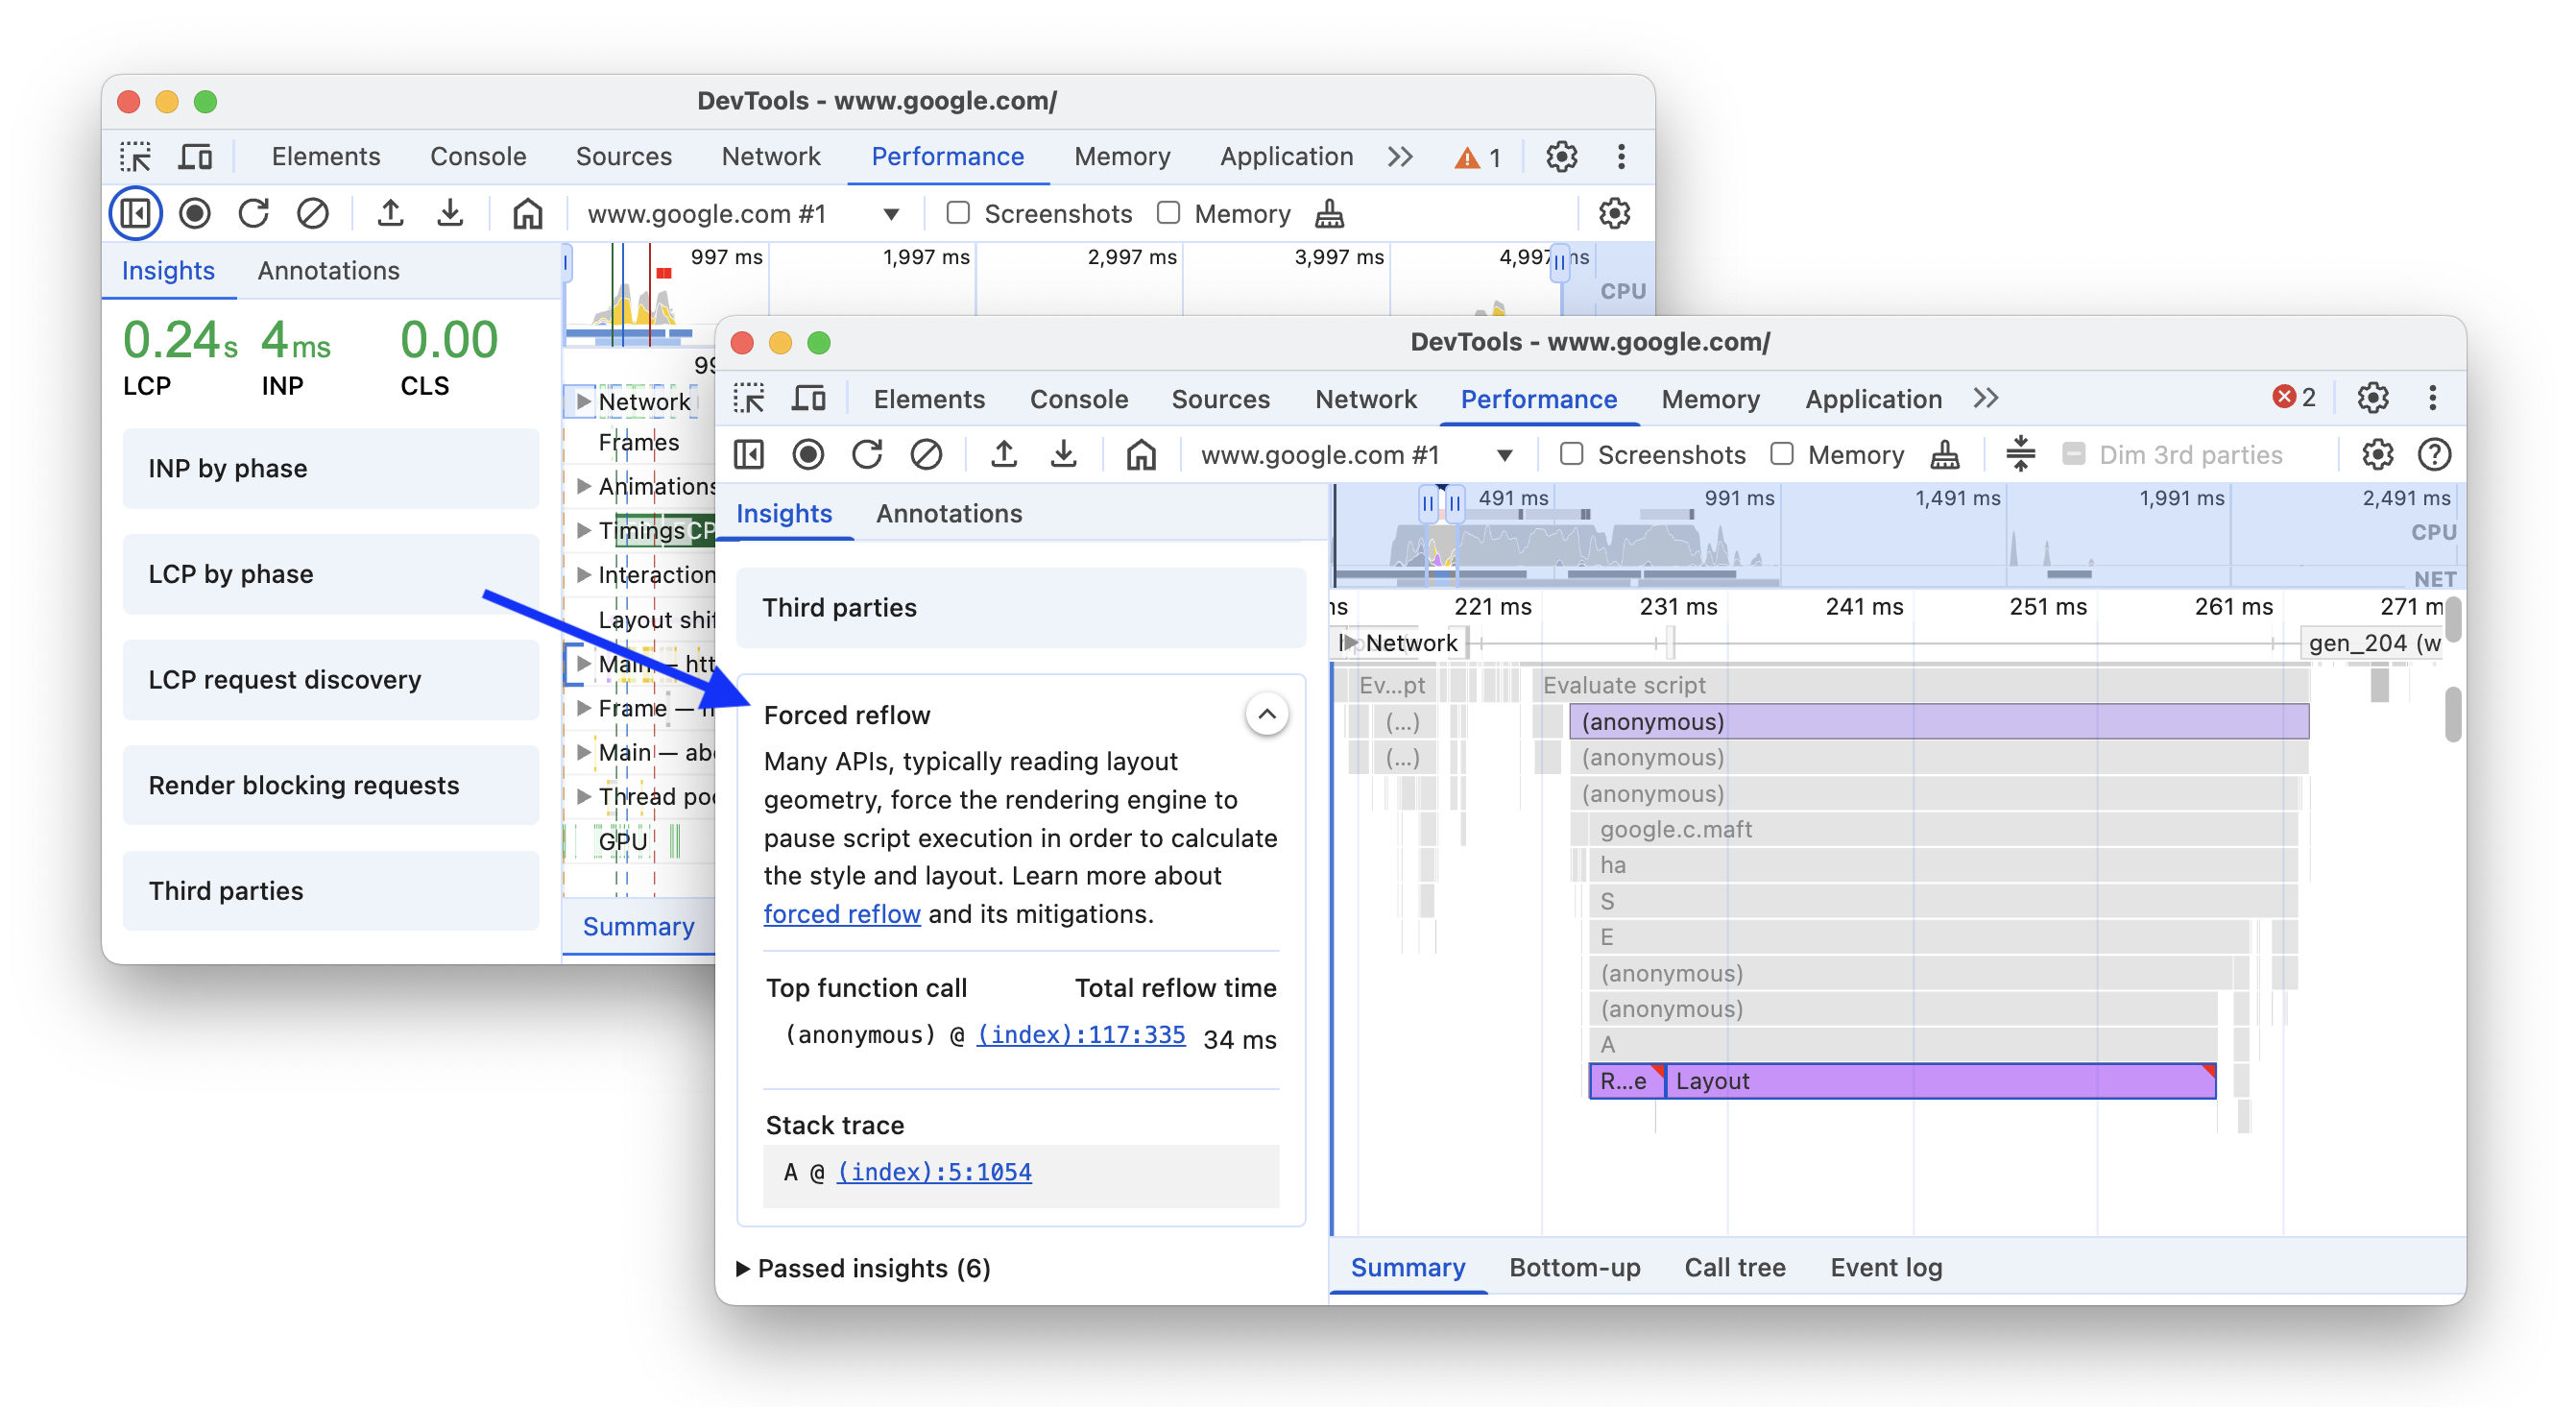
The Performance > Insights tab gets a new addition to the set of insights: Forced reflow. Forced reflow happens when the rendering engine pauses script execution to calculate style and layout. Forced reflows can be bottlenecks you may want to avoid.
As you hover over the new insight, it highlights the top function call with a forced reflow, its stack trace, and shows the total reflow time.
Chromium issue: 369766156.
'Optimize DOM size' insight
Another new insight is Optimize DOM size. A large DOM tree can slow down your page performance.
The insight highlights long layout reflows and style recalculations that were affected by a large DOM size in the performance trace and provides statistics on total elements, depth, and most children.

Extend the performance trace with console.timeStamp
The Extensibility API now supportsconsole.timeStamp. In addition to performance.measure and performance.mark, you can now create custom tracks in the performance trace and capture custom marks using console.timeStamp, as lighter alternative that doesn't add entries to the browser's internal performance timeline but only shows them in the performance trace.
For example, you can use the following syntax:
console.timeStamp("Start");
// Some time later ...
console.timeStamp("End");
// Some time later ...
console.timeStamp("Measure 1", "Start", "End", "Track 1");
// Some time later ...
console.timeStamp("Measure 2", "Start", undefined, "Track 1");
With Capture settings > Show custom tracks, you will see your custom track in the trace:

Elements panel improvements
This version brings a number of improvements to the Elements panel.
Real-time values of animated styles
The Elements > Styles tab now updates the values of animated styles in real-time.
Support for :open pseudo-class and various pseudo-elements
The Elements panel now supports the :open pseudo-class in the Styles > :hov > Force specific element state section for certain HTML elements such as <details>, <select>, <dialog>, and <input>.

Additionally, the Elements panel now also supports several new pseudo-elements: ::checkmark, ::picker-icon, and carousel-related ::column, ::scroll-button, ::scroll-marker, and ::scroll-marker-group.
Chromium issues: 383157184, 379805728.
Copy all console messages
You can now right-click-copy all console messages at once.

Additionally, you can find a similar copy option in the context menu of Network > Request Payload.
Chromium issues: 40206460, 384967020.
Byte units in the Memory panel
The Memory panel now shows sizes with appropriate byte units instead of big numbers of bytes.

Chromium issue: 388589515.
Miscellaneous highlights
These are some noteworthy fixes and improvements in this release:
- Performance:
- Annotations: You can now click your label to select the corresponding entry (crbug.com/388224764).
- Insights: Clicking CLS in the Insights tab now selects the worst cluster instead of the worst shift.
- Ignore list: Node internals starting with
node:are now ignored by default (crbug.com/382453615). - Live expressions: Fixed bug that caused live expression to affect the
$_command (crbug.com/388437265). - Elements > Styles: Relative lengths now have a popover that shows the absolute value (crbug.com/40778486).
- Accessibility: Column headers now announce if they are sortable.
- Tab icons are now on the right side next to tab names instead of the left.
Download the preview channels
Consider using the Chrome Canary, Dev, or Beta as your default development browser. These preview channels give you access to the latest DevTools features, let you test cutting-edge web platform APIs, and help you find issues on your site before your users do!
Get in touch with the Chrome DevTools team
Use the following options to discuss the new features, updates, or anything else related to DevTools.
- Submit feedback and feature requests to us at crbug.com.
- Report a DevTools issue using the More options > Help > Report a DevTools issue in DevTools.
- Tweet at @ChromeDevTools.
- Leave comments on What's new in DevTools YouTube videos or DevTools Tips YouTube videos.
What's new in DevTools
A list of everything that has been covered in the What's new in DevTools series.
- DevTools MCP server updates
- Improved trace sharing
- Support for @starting-style
- Editor widget for display: masonry
- Lighthouse 13
- Code suggestions from Gemini
- Enhancements for the DevTools MCP server
- Quicker access to AI assistance
- Debug the full performance trace with Gemini
- Toggle drawer orientation
- Google Developer Program
- Miscellaneous highlights
- Chrome DevTools (MCP) for your AI agent
- Debug the network dependency tree with Gemini
- Export your chats with Gemini
- Persisted track configuration in the Performance panel
- Filter IP protected network requests
- Elements > Layout tab adds masonry layout support
- Lighthouse 12.8.2
- Miscellaneous highlights
- Debug more insights with Gemini
- Emulate the 'Save-Data' header in 'Network conditions'
- See the Baseline status in a CSS property tooltip
- Override form factors in user agent client hints
- Lighthouse 12.8.0
- Miscellaneous highlights
- A more reliable and productive Chrome DevTools
- Upload images in AI assistance for styling
- Add request headers to the table in Network
- Check out the highlights from Google I/O 2025
- Miscellaneous highlights
- Performance panel improvements
- Preconnected origins in 'Network dependency tree' insight
- Server response and redirection times in 'Document request latency' insight
- Redirects in Summary of network requests
- Reduced noise in the performance trace
- Deprecated 'Disable JavaScript samples'
- Geolocation accuracy parameter in Sensors
- Elements panel improvements
- Debug complex CSS values easier
- @function support in Elements > Styles