
Debugging support for Trusted Types violations
Breakpoint on Trusted Type violations
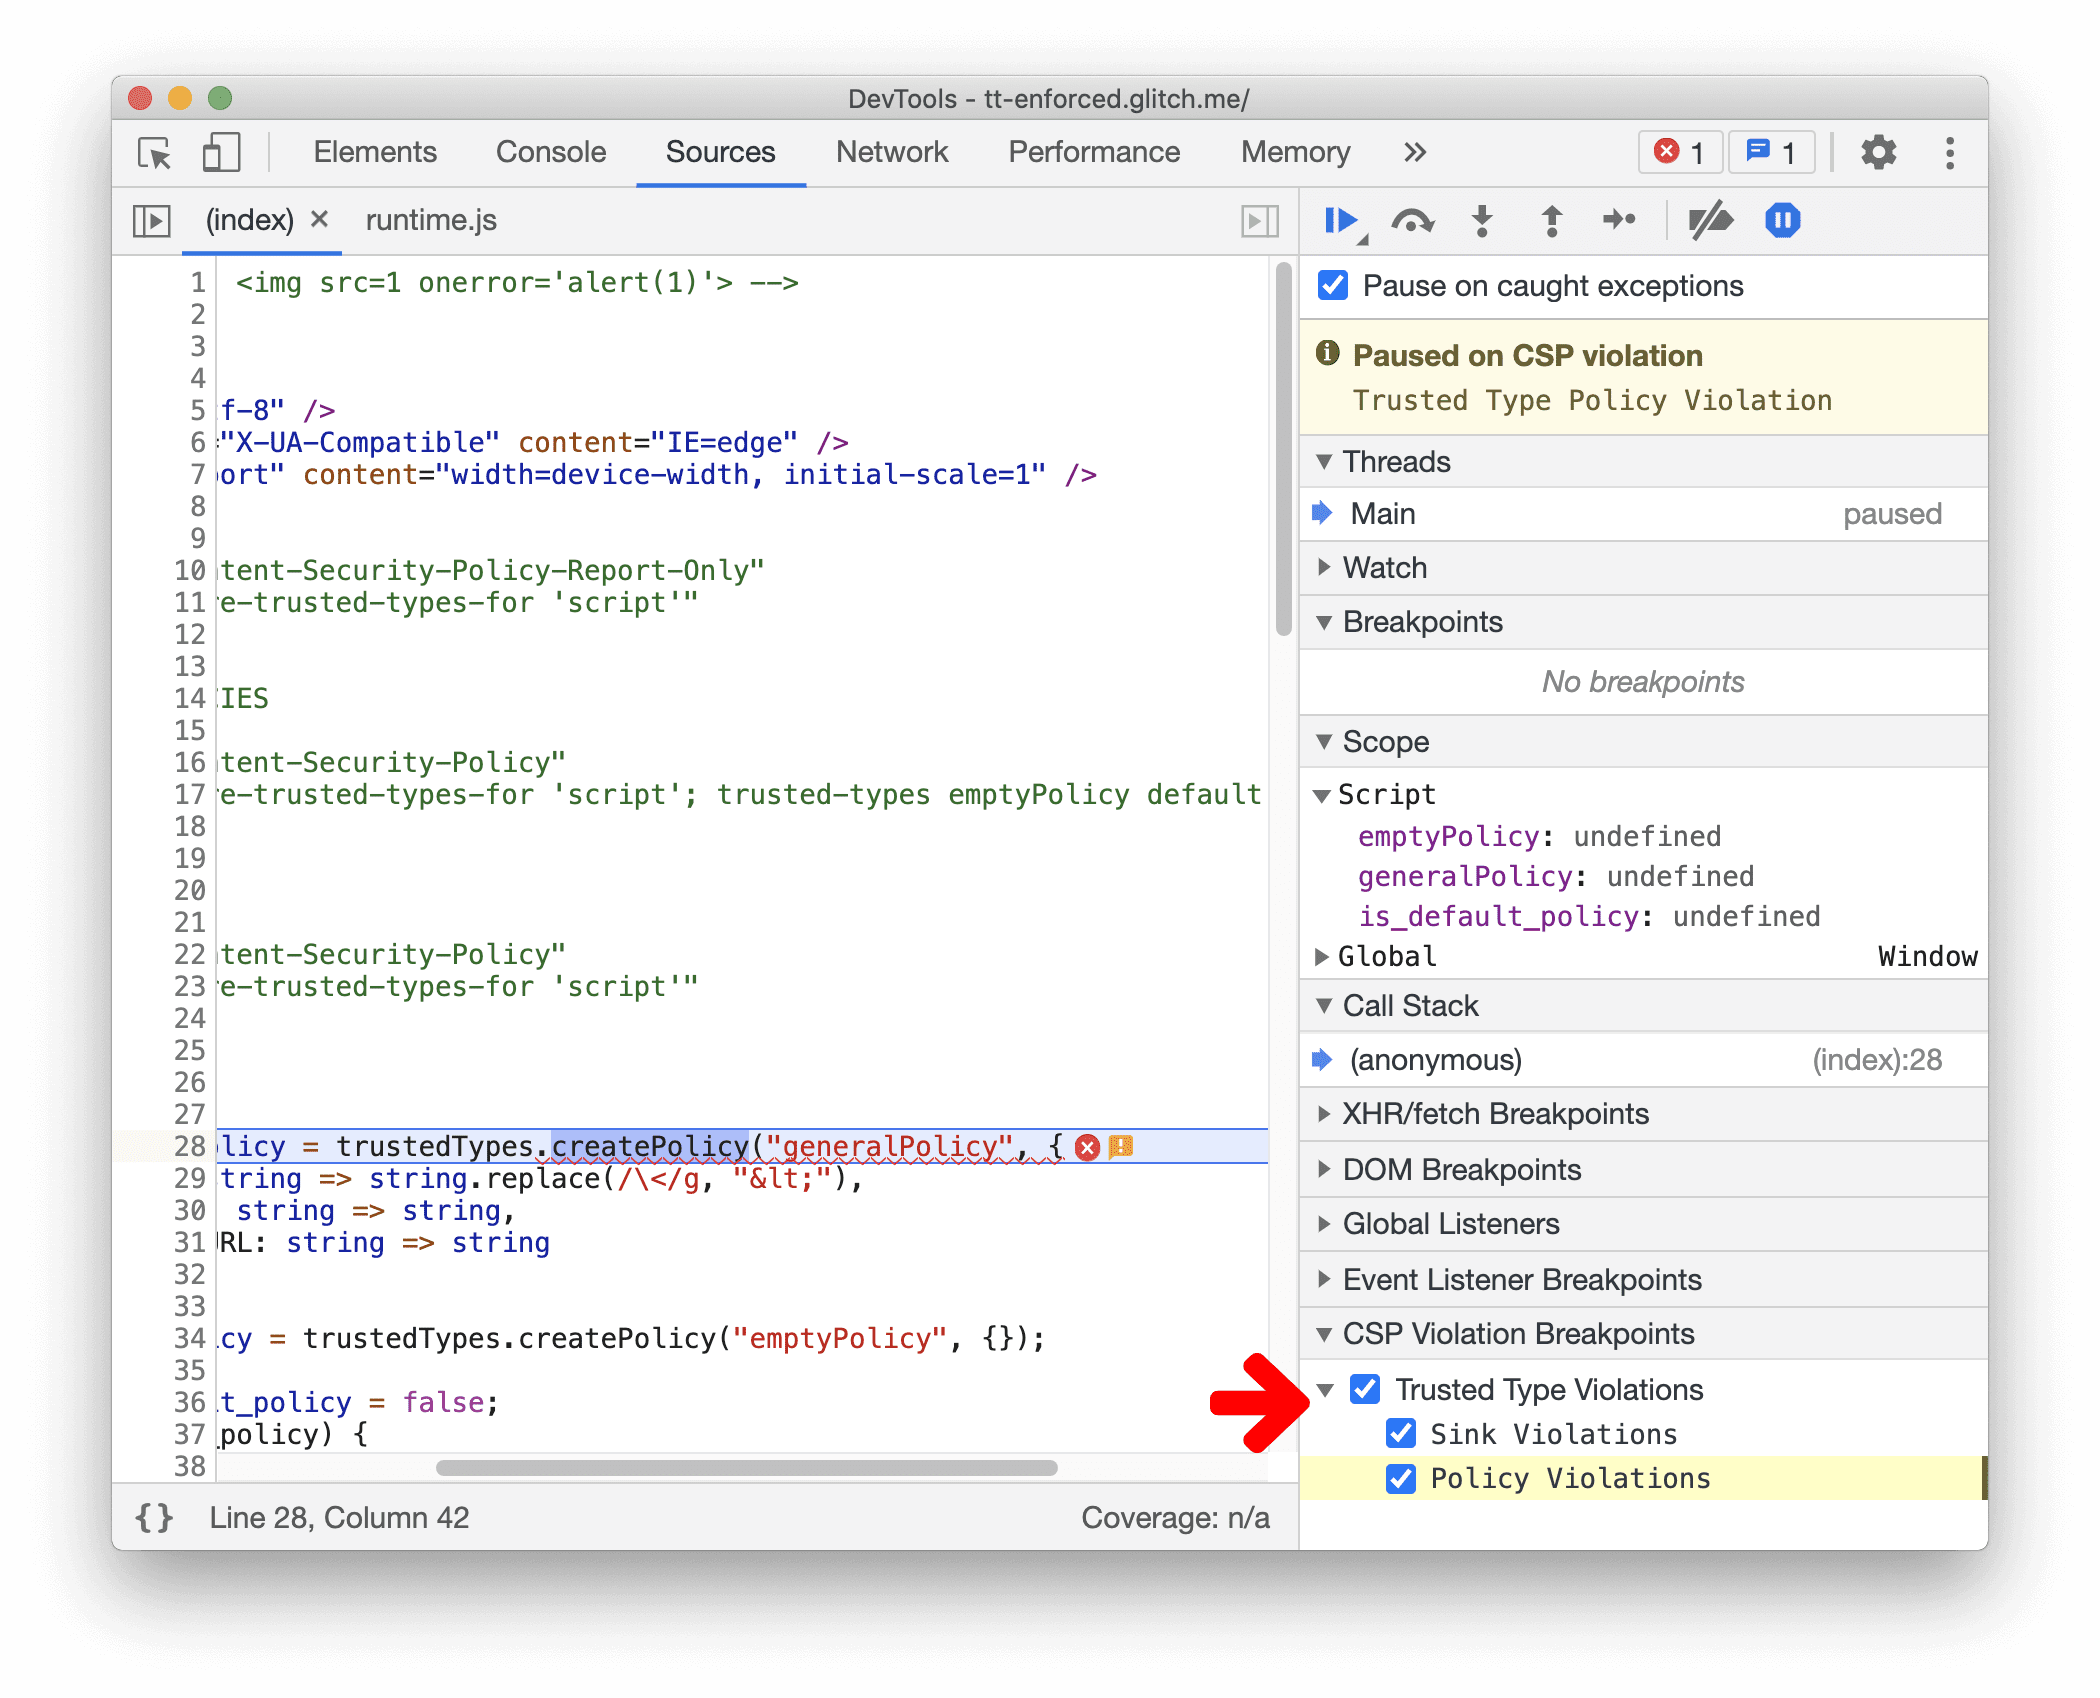
You can now set breakpoints and catch exceptions on Trusted Type Violations in the Sources panel.
Trusted Types API helps you prevent DOM-based cross-site scripting vulnerabilities. Learn how to write, review and maintain applications free of DOM XSS vulnerabilities with Trusted Types here.
In the Sources panel, open the debugger sidebar pane. Expand the CSP Violation Breakpoints section and enable the Trusted Type violations checkbox to pause on the exceptions. Try it yourself with this demo page.
Chromium issue: 1142804
Link issue in the Sources panel to the Issues tab
The Sources panel now shows a warning icon next to the line that violates Trusted Type. Hover on it to preview the exception. Click on it to expand the Issues tab, it provides more details on the exceptions and guidance on how to fix it.

Chromium issue: 1150883
Capture node screenshot beyond viewport
You can now capture node screenshots for a full node, including content below the fold. Previously, the screenshot was cut off for content not visible in the viewport. The full-page screenshots are precise now as well.
In the Elements panel, right click on an element and select Capture node screenshot.

Chromium issue: 1003629
New Trust Tokens tab for network requests
Inspect the Trust Token network requests with the new Trust Tokens tab.
Trust Token is a new API to help combat fraud and distinguish bots from real humans, without passive tracking. Learn how to get started with Trust Tokens.
Further debugging support will come in the next releases.

Chromium issue: 1126824
Lighthouse 7 in the Lighthouse panel
The Lighthouse panel is now running Lighthouse 7. Check out the release notes for a full list of changes.
New audits in Lighthouse 7:
- Preload Largest Contentful Paint (LCP) image. Audits if the image used by the LCP element is preloaded in order to improve your LCP time.
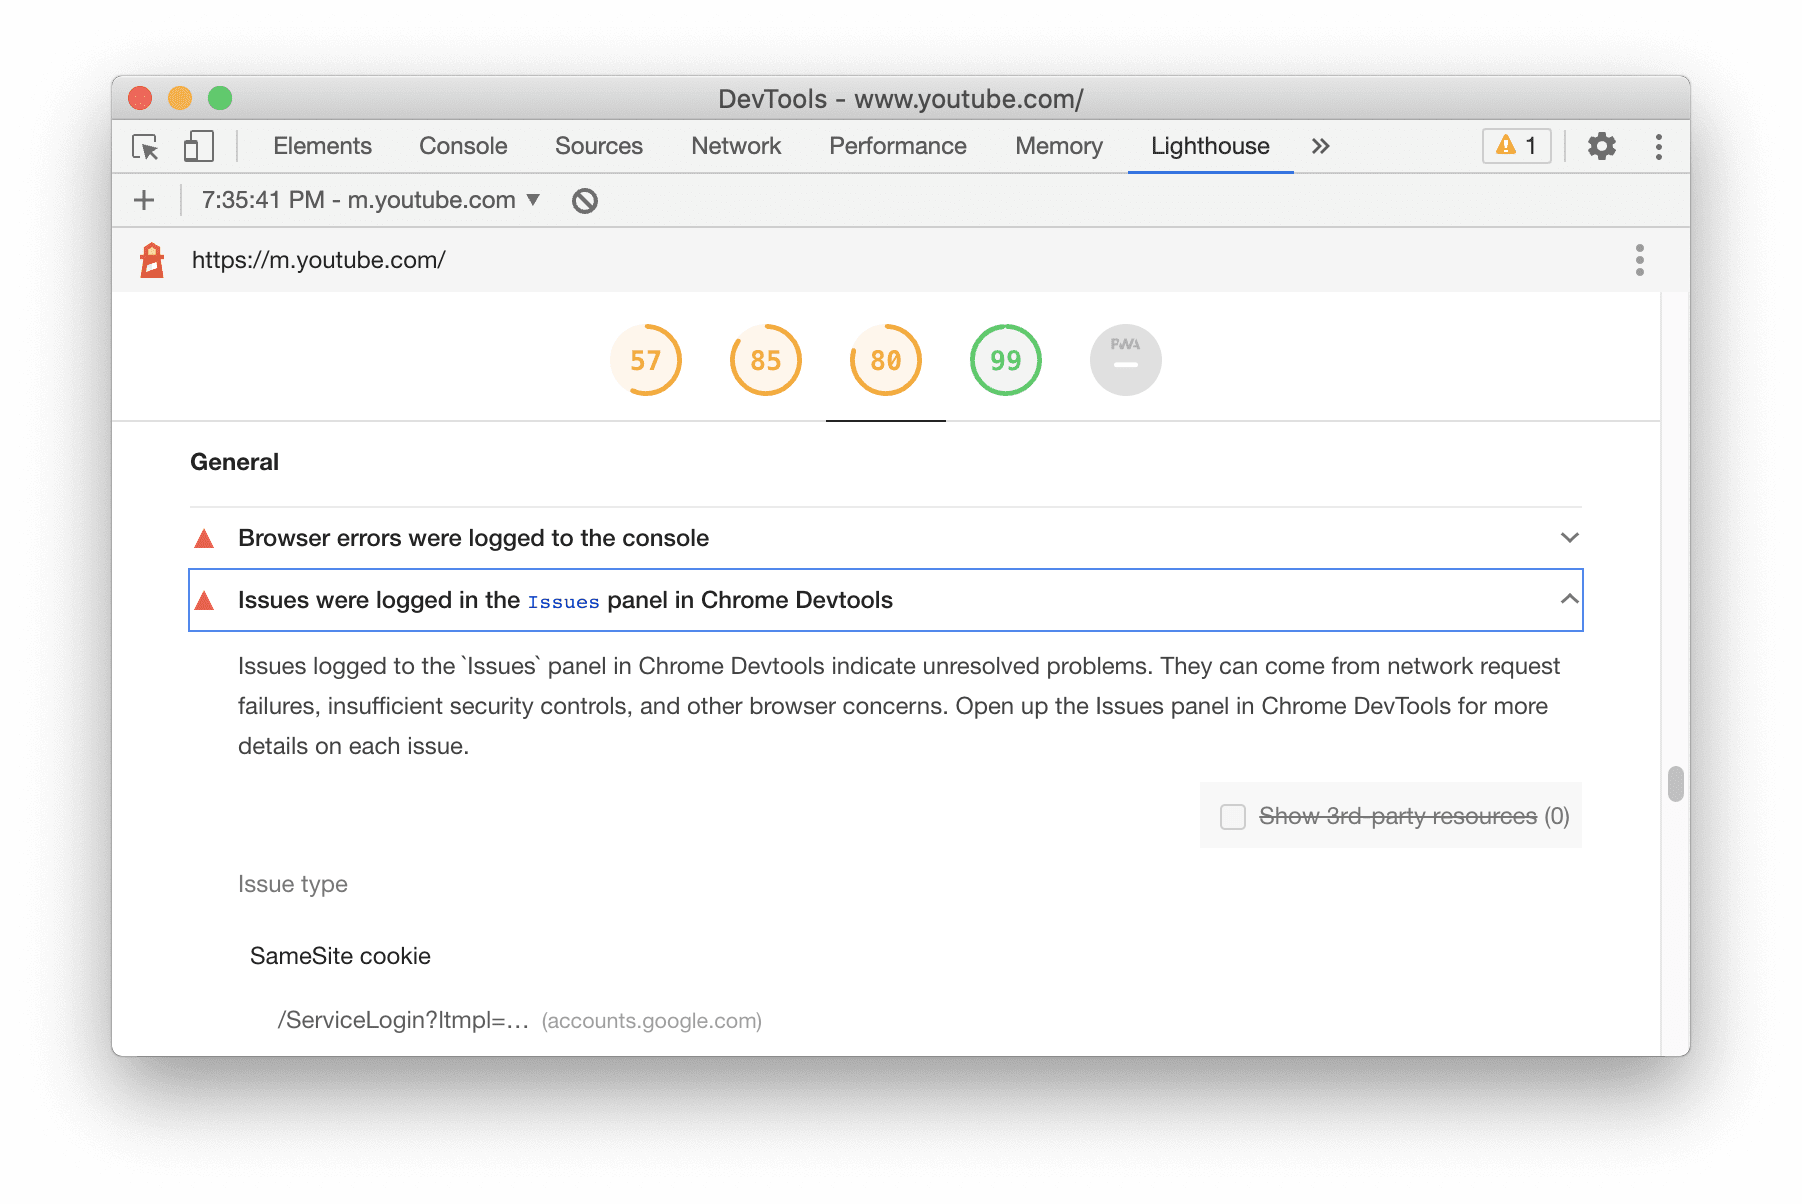
- Issues logged to the
Issuespanel. Indicates a list of unresolved issues in theIssuespanel. - Progressive Web Apps (PWA). The PWA Category changed fairly significantly.
The Installable group is now powered entirely by the capability checks that enable Chrome's installable criteria. These are the same signals seen in the Manifest pane.
- The "Registers a service worker…" audit moves to the PWA Optimized group, and the "Uses HTTPS" audit is now included as part of the key "installability requirements" audit.
- The Fast and reliable group is removed. As the revamped "installability requirements" audit includes offline-capability checking, the "current page and start_url respond with 200 when offline" audit was removed. The "Page load is fast enough on mobile network" audit was removed too.
Chromium issue: 772558
Elements panel updates
Support forcing the CSS :target state
You can now use DevTools to force and inspect the CSS :target state.
In the Elements panel, select an element and toggle the element state. Enable the :target
checkbox to force and inspect the styles.
Use the :target pseudo-class to style element when the hash in the URL and the id of an element
are the same. Check out this demo to try it yourself. This new DevTools feature lets you test
such styles without having to manually change the URL all the time.

Chromium issue: 1156628
New shortcut to duplicate element
Use the new Duplicate element shortcut to clone an element instantly.
Right click an element in the Elements panel, select Duplicate element. A new element will be created under it.
Alternatively, you can duplicate element with keyboard shortcuts:
- Mac:
Shift+Option+⬇️ - Window/ Linux:
Shift+Alt+⬇️

Chromium issues: 1150797, 1150797
Color pickers for custom CSS properties
The Styles pane now shows color pickers for custom CSS properties.
In addition, you can hold the Shift key and click on color picker to cycle through the RGBA, HSLA,
and Hex representations of the color value.

Chromium issue: 1147016
New shortcuts to copy CSS properties
You can now copy CSS properties quicker with a few new shortcuts.
In the Elements panel, select an element. Then, right-click on a CSS class or a CSS property in the Styles pane to copy the value.
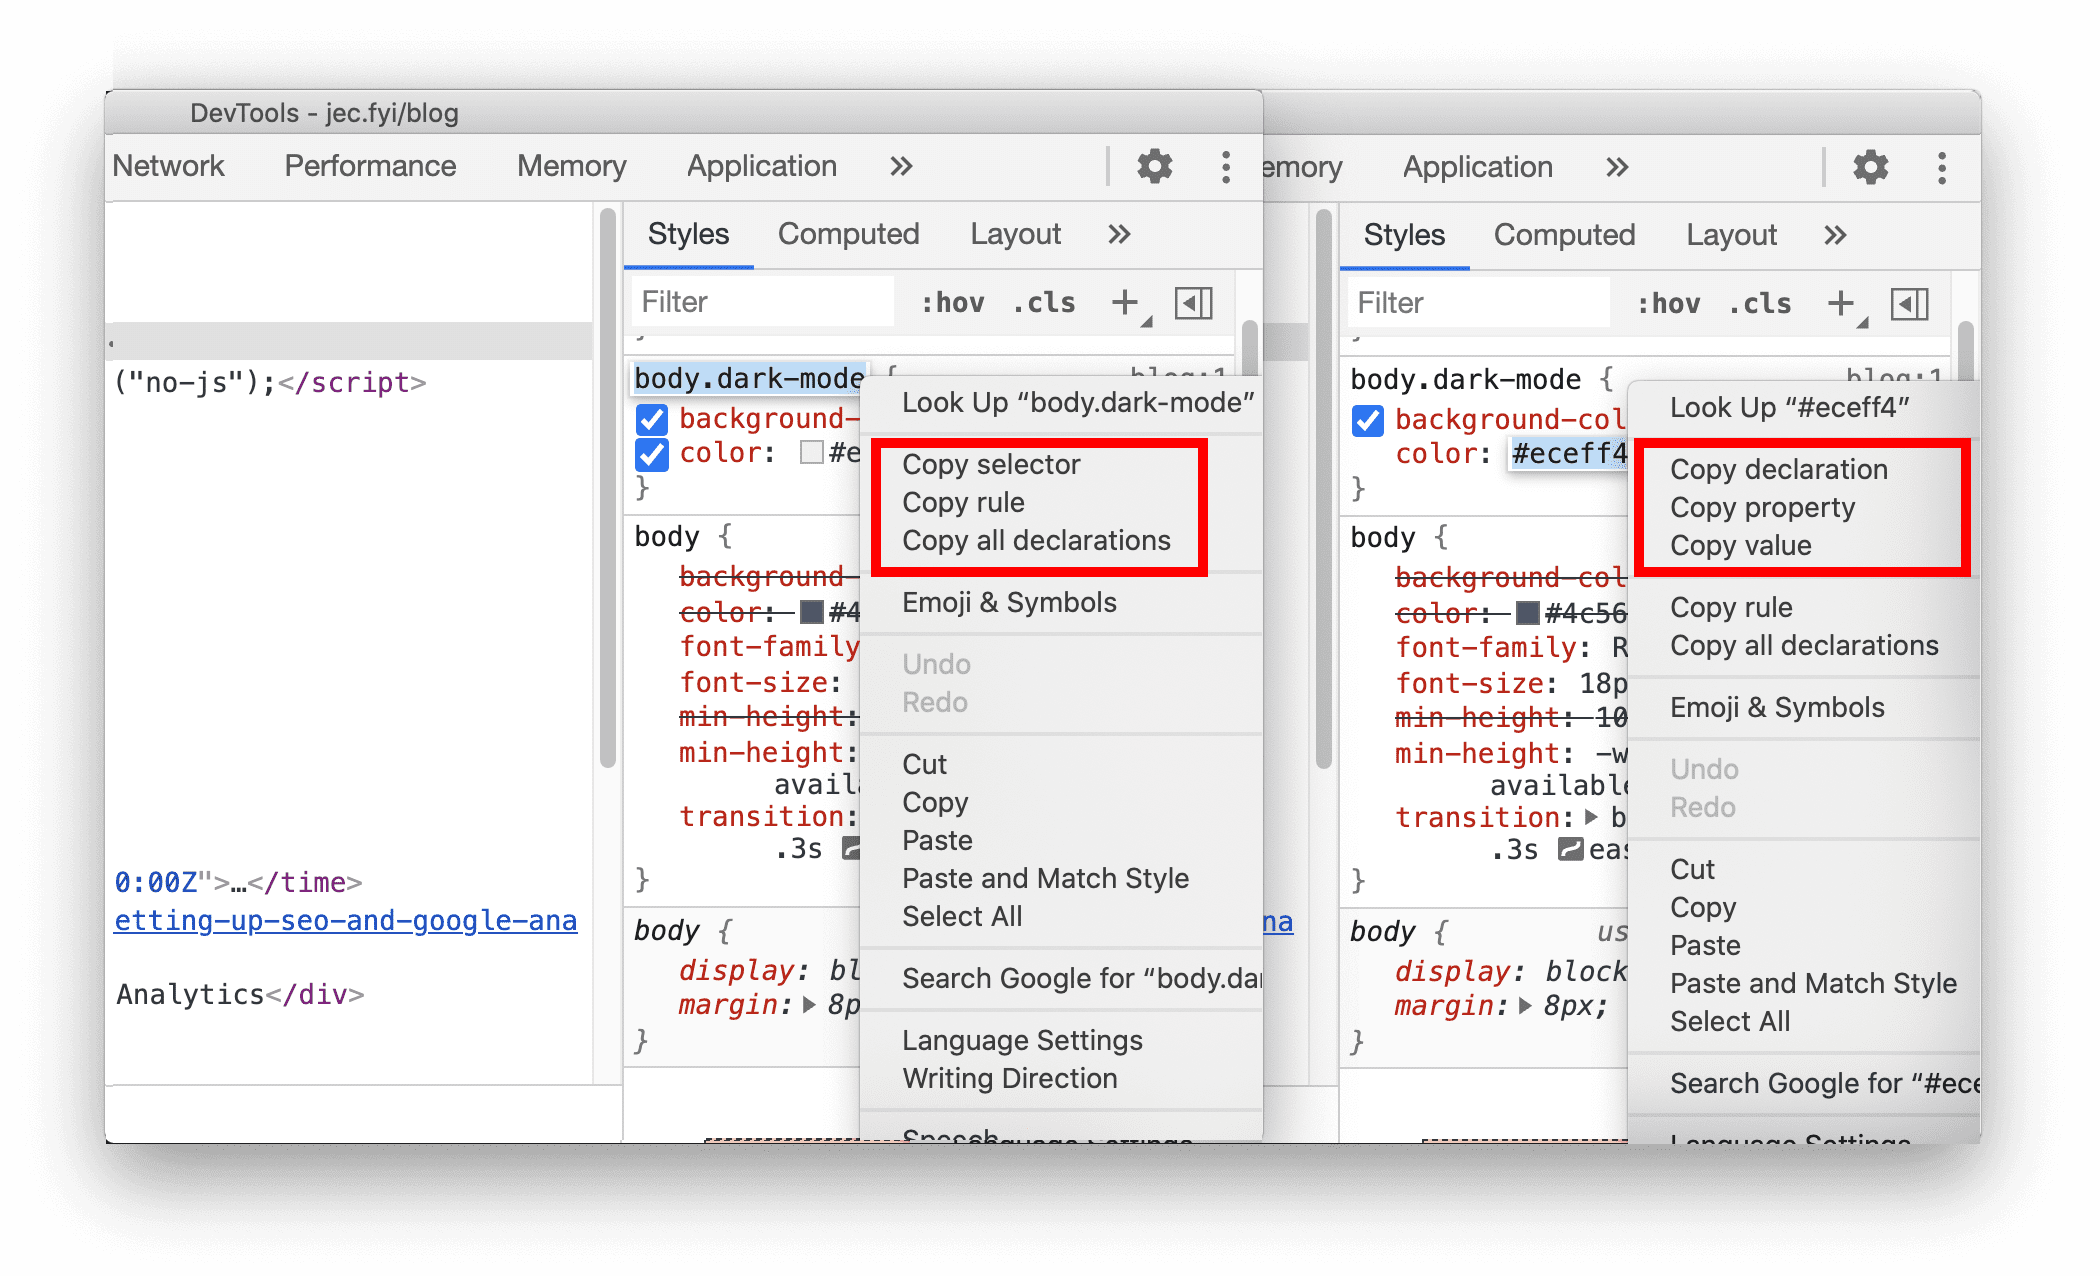
Copy options for CSS class:
- Copy selector. Copy the current selector name.
- Copy rule. Copy the rule of the current selector.
- Copy all declarations: Copy all declarations under the current rule, including invalid and prefixed properties.
Copy options for CSS property:
- Copy declaration. Copy the declaration of the current line.
- Copy property. Copy the property of the current line.
- Copy value: Copy the value of the current line.
Chromium issue: 1152391
Cookies updates
New option to show URL-decoded cookies
You can now opt to view the URL-decoded cookies value in the Cookies pane.
Go to the Application panel and select the Cookies pane. Select any cookie on the list. Enable the new Show URL decoded checkbox to view the decoded cookie.

Chromium issue: 997625
Clear only visible cookies
The Clear all cookies button in the Cookies pane is now replaced by Clear filtered cookies button.
In the Application panel > Cookies pane, enter text in the textbox to filter the cookies. In our example here, we filter the list by "PREF". Click on the Clear filtered cookies button to delete the visible cookies. Clear the filter text and you will see the other cookies remain in the list. Previously, you only had the option to clear all cookies.

Chromium issue: 978059
New option to clear third-party cookies in the Storage pane
When clearing the site data in the Storage pane, DevTools now clear only first-party cookies by default. Enable the including third-party cookies to clear the third-party cookies as well.

Chromium issue: 1012337
Edit User-Agent Client Hints for custom devices
You can now edit User-Agent Client Hints for custom devices.
Go to Settings > Devices and click on Add custom device.... Expand the User agent client hints section to edit the client hints.

User-Agent Client Hints are an alternative to User-Agent string that enables developers to access information about a user's browser in a privacy-preserving and ergonomic way. Learn more about User-Agent Client Hints in web.dev/user-agent-client-hints/.
Chromium issue: 1073909
Network panel updates
Persist "record network log" setting
DevTools now persist the "Record network log" setting. Previously, DevTools reset the user's choice whenever a page reloads.

Chromium issue: 1122580
View WebTransport connections in the Network panel
Network panel now displays WebTransport connections.

WebTransport is a new API offering low-latency, bidirectional, client-server messaging. Learn more about its use cases, and how to give feedback about the future of the implementation in web.dev/webtransport/.
Chromium issue: 1152290
"Online" renamed to "No throttling"
The network emulation option "Online" is now renamed to "No Throttling".

Chromium issue: 1028078
New copy options in the Console, Sources panel, and Styles pane
New shortcuts to copy object in the Console and Sources panel
You can now copy object values with the new shortcuts in the Console and Sources panel. This is handy especially when you have a large object (e.g. a long array) to copy.


Chromium issues: 1149859, 1148353
New shortcuts to copy file name in the Sources panel and Styles pane
You can now copy file name by right clicking on:
- a file in the Sources panel, or
- the file name in the Styles pane in the Elements panel
Select Copy file name from the context menu to copy the file name.


Chromium issue: 1155120
Frame details view updates
New Service Workers information in the Frame details view
DevTools now displays dedicated service workers under the frame which creates them.
In the Application panel, expand a frame with service workers, then select a service worker under the Service Workers tree to view the details.

Chromium issue: 1122507
Measure Memory information in the Frame details view
The performance.measureMemory() API status is now displayed under the API availability
section.
The new performance.measureMemory() API estimates the memory usage of the entire web page. Learn
how to monitor your web page's total memory usage with this new API in this article.

Chromium issue: 1139899
Provide feedback from the Issues tab
If you ever want to improve an issue message, go to the Issues tab from the Console or More Settings > More tools > Issues > to open the Issues tab. Expand an issue message, and click on the Is the issue message helpful to you?, then you can provide feedback in the pop up.

Dropped frames in the Performance panel
When analyzing load performance in the Performance panel, the Frames section now marks dropped frames as red. Hover on it to find out the frame rate.

Chromium issue: 1075865
Emulate foldable and dual-screen in Device Mode
You can now emulate dual-screen and foldable devices in DevTools.
After enabling the Device Toolbar, select one of these devices: Surface Duo or Samsung Galaxy Fold.
Click on the new span icon to toggle between single-screen or folded and dual-screen or unfolded postures.
You can also enable the Experimental Web Platform features to access the new CSS media
screen-spanning feature and JavaScript getWindowSegments API. The experimental icon displays the
state of the Experimental Web Platform features flag. The icon is highlighted when the flag is
turned on. Navigate to chrome://flags and toggle the flag.

Chromium issue: 1054281
Experimental features
Automate browser testing with Puppeteer Recorder
DevTools can now generate Puppeteer scripts based on your interaction with the browser, making it easier for you to automate browser testing. Puppeteer is a Node.js library which provides a high-level API to control Chrome or Chromium over the DevTools Protocol.
Go to this demo page. Open the Sources panel in DevTools. Select the Recording tab on the left pane. Add a new recording and name the file (e.g. test01.js).
Click on the Record button at the bottom to start recording the interaction. Try to fill in the on-screen form. Observe that Puppeteer commands are appended to the file accordingly. Click on the Record button again to stop the recording.
To run the script, follow the Getting started guide in Puppeteer official site.
Please note that this is an early-stage experiment. We plan to improve and expand the Recorder functionality over time.

Chromium issue: 1144127
Font editor in the Styles pane
The new Font Editor is a popover editor in the Styles pane for font related properties to help you find the perfect typography for your webpage.
The popover provides a clean UI to dynamically manipulate typography with a series of intuitive input types.

Chromium issue: 1093229
CSS flexbox debugging tools
DevTools added experimental support for flexbox debugging since last release.
DevTools now draws a guiding line to help you better visualize the CSS align-items property. The
CSS gap property is supported as well. In our example here, we have CSS gap: 12px;. Notice the
hatching pattern for each gap.

Chromium issue: 1139949
New CSP Violations tab
View all Content Security Policy (CSP) violations at a glance in the new CSP Violations tab. This new tab is an experiment that should make it easier to work with web pages with a large amount of CSP and Trusted Type violations.

Chromium issue: 1137837
New color contrast calculation - Advanced Perceptual Contrast Algorithm (APCA)
The Advanced Perceptual Contrast Algorithm (APCA) is replacing the AA/AAA guidelines contrast ratio in the Color Picker.
APCA is a new way to compute contrast based on modern research on color perception. Compared to AA/AAA guidelines, APCA is more context-dependent. The contrast is calculated based on the text's spatial properties (font weight & size), color (perceived lightness difference between text and background), and context (ambient light, surroundings, intended purpose of the text).

The example show the APCA threshold is 38%. The contrast ratio must meet or exceed the listed value. This value is calculated based on font weight and size, referring to this APCA lookup table.
Chromium issue: 1121900
Download the preview channels
Consider using the Chrome Canary, Dev, or Beta as your default development browser. These preview channels give you access to the latest DevTools features, let you test cutting-edge web platform APIs, and help you find issues on your site before your users do!
Get in touch with the Chrome DevTools team
Use the following options to discuss the new features, updates, or anything else related to DevTools.
- Submit feedback and feature requests to us at crbug.com.
- Report a DevTools issue using the More options > Help > Report a DevTools issue in DevTools.
- Tweet at @ChromeDevTools.
- Leave comments on What's new in DevTools YouTube videos or DevTools Tips YouTube videos.
What's new in DevTools
A list of everything that has been covered in the What's new in DevTools series.
- DevTools MCP server updates
- Improved trace sharing
- Support for @starting-style
- Editor widget for display: masonry
- Lighthouse 13
- Code suggestions from Gemini
- Enhancements for the DevTools MCP server
- Quicker access to AI assistance
- Debug the full performance trace with Gemini
- Toggle drawer orientation
- Google Developer Program
- Miscellaneous highlights
- Chrome DevTools (MCP) for your AI agent
- Debug the network dependency tree with Gemini
- Export your chats with Gemini
- Persisted track configuration in the Performance panel
- Filter IP protected network requests
- Elements > Layout tab adds masonry layout support
- Lighthouse 12.8.2
- Miscellaneous highlights
- Debug more insights with Gemini
- Emulate the 'Save-Data' header in 'Network conditions'
- See the Baseline status in a CSS property tooltip
- Override form factors in user agent client hints
- Lighthouse 12.8.0
- Miscellaneous highlights
- A more reliable and productive Chrome DevTools
- Upload images in AI assistance for styling
- Add request headers to the table in Network
- Check out the highlights from Google I/O 2025
- Miscellaneous highlights
- Performance panel improvements
- Preconnected origins in 'Network dependency tree' insight
- Server response and redirection times in 'Document request latency' insight
- Redirects in Summary of network requests
- Reduced noise in the performance trace
- Deprecated 'Disable JavaScript samples'
- Geolocation accuracy parameter in Sensors
- Elements panel improvements
- Debug complex CSS values easier
- @function support in Elements > Styles
- Network panel improvements
- has-request-header filter
- Direct Sockets in Isolated Web Apps
- Miscellaneous highlights
- Accessibility
- Google I/O 2025 edition
- Modify and save CSS changes to your workspace with Gemini
- Connect a workspace folder and save changes back to your source files
- Ask Gemini about performance insights
- Annotate performance findings with Gemini
- Add screenshots to your chats with Gemini
- New insights in the Performance panel
- Duplicated JavaScript
- Legacy JavaScript
- Speculations now support rule tags
- Lighthouse 12.6.0
- Miscellaneous highlights
- Accessibility
- Performance panel improvements
- New performance insights
- Click to highlight
- Server timings in Summary of network requests
- Filter cookies in 'Privacy and security'
- Sizes in kB units in tables across panels
- Autocomplete supports corner-shape and corner-*-shape in Elements > Styles
- Experimental: Highlighting issues with elements and attributes in DOM
- Lighthouse 12.5.0
- Miscellaneous highlights
- Performance panel improvements
- Origin and script links for profile and function calls in Performance
- LCP by phase field data support
- Network dependency tree insight
- Duration instead of total and self time in Summary
- Heaviest stack highlighting
- Improved empty states for various panels
- Accessibility tree view in Elements
- Lighthouse 12.4.0
- Miscellaneous highlights
- Privacy and security panel
- Performance panel improvements
- Calibrated CPU throttling presets
- Select different performance events in the same AI chat
- First- and third-party highlighting in Performance
- Field data in marker tooltips and insights
- Forced reflow insight
- 'Optimize DOM size' insight
- Extend the performance trace with console.timeStamp
- Elements panel improvements
- Real-time values of animated styles
- Support for :open pseudo-class and various pseudo-elements
- Copy all console messages
- Byte units in the Memory panel
- Miscellaneous highlights
- Persistent AI chat history
- Performance panel improvements
- Image delivery insight
- Classic and modern keyboard navigation
- Ignore irrelevant scripts in the flame chart
- Timeline marker and range highlighting on hover
- Recommended throttling settings
- Timings markers in an overlay
- Stack traces of JS calls in Summary
- Badge settings moved to menu in Elements
- New 'What's new' panel
- Lighthouse 12.3.0
- Miscellaneous highlights
- Debug network requests, source files, and performance traces with Gemini
- View AI chat history
- Manage extension storage in Application > Storage
- Performance improvements
- Interaction phases in live metrics
- Render blocking information in the Summary tab
- Support for scheduler.postTask events and their initiator arrows
- Animations panel and Elements > Styles tab improvements
- Jump from Elements > Styles to Animations
- Real-time updates in Computed tab
- Compute pressure emulation in Sensors
- JS objects with the same name grouped by source in the Memory panel
- A new look for settings
- Performance insights panel is deprecated and removed from DevTools
- Miscellaneous highlights
- Debug CSS with Gemini
- Control AI features in a dedicated settings tab
- Performance panel improvements
- Annotate and share performance findings
- Get performance insights right in the Performance panel
- Spot excessive layout shifts easier
- Spot the non-composited animations
- Hardware concurrency moves to Sensors
- Ignore anonymous scripts and focus on your code in stack traces
- Elements > Styles: Support for sideways-* writing modes for grid overlays and CSS-wide keywords
- Lighthouse audits for non-HTTP pages in timespan and snapshot modes
- Accessibility improvements
- Miscellaneous highlights
- Network panel improvements
- Network filters reimagined
- HAR exports now exclude sensitive data by default
- Elements panel improvements
- Autocomplete values for text-emphasis-* properties
- Scroll overflows marked with a badge
- Performance panel improvements
- Recommendations in live metrics
- Navigate breadcrumbs
- Memory panel improvements
- New 'Detached elements' profile
- Improved naming of plain JS objects
- Turn off dynamic theming
- Chrome Experiment: Process sharing
- Lighthouse 12.2.1
- Miscellaneous highlights
- Recorder supports export to Puppeteer for Firefox
- Performance panel improvements
- Live metrics observations
- Search requests in the Network track
- See stack traces of performance.mark and performance.measure calls
- Use test address data in the Autofill panel
- Elements panel improvements
- Force more states for specific elements
- Elements > Styles now autocompletes more grid properties
- Lighthouse 12.2.0
- Miscellaneous highlights
- Console insights by Gemini are going live in most European countries
- Performance panel updates
- Enhanced Network track
- Customize performance data with extensibility API
- Details in the Timings track
- Copy all listed requests in the Network panel
- Faster heap snapshots with named HTML tags and less clutter
- Open Animations panel to capture animations and edit @keyframes live
- Lighthouse 12.1.0
- Accessibility improvements
- Miscellaneous highlights
- Inspect CSS anchor positioning in the Elements panel
- Sources panel improvements
- Enhanced 'Never Pause Here'
- New scroll snap event listeners
- Network panel improvements
- Updated network throttling presets
- Service worker information in custom fields of the HAR format
- Send and receive WebSocket events in the Performance panel
- Miscellaneous highlights
- Performance panel improvements
- Move and hide tracks with updated track configuration mode
- Ignore scripts in the flame chart
- Throttle down the CPU by 20 times
- Performance insights panel will be deprecated
- Find excessive memory usage with new filters in heap snapshots
- Inspect storage buckets in Application > Storage
- Disable self-XSS warnings with a command-line flag
- Lighthouse 12.0.0
- Miscellaneous highlights
- Understand errors and warnings in the Console better with Gemini
- @position-try rules support in Elements > Styles
- Sources panel improvements
- Configure automatic pretty-printing and bracket closing
- Handled rejected promises are recognized as caught
- Error causes in the Console
- Network panel improvements
- Inspect Early Hints headers
- Hide the Waterfall column
- Performance panel improvements
- Capture CSS selector statistics
- Change order and hide tracks
- Ignore retainers in the Memory panel
- Lighthouse 11.7.1
- Miscellaneous highlights
- New Autofill panel
- Enhanced network throttling for WebRTC
- Scroll-driven animations support in the Animations panel
- Improved CSS nesting support in Elements > Styles
- Enhanced Performance panel
- Hide functions and their children in the flame chart
- Arrows from selected initiators to events they initiated
- Lighthouse 11.6.0
- Tooltips for special categories in Memory > Heap snapshots
- Application > Storage updates
- Bytes used for shared storage
- Web SQL is fully deprecated
- Coverage panel improvements
- The Layers panel might be deprecated
- JavaScript Profiler deprecation: Phase four, final
- Miscellaneous highlights
- Find the Easter egg
- Elements panel updates
- Emulate a focused page in Elements > Styles
- Color Picker, Angle Clock, and Easing Editor in
var()fallbacks - CSS length tool is deprecated
- Popover for the selected search result in the Performance > Main track
- Network panel updates
- Clear button and search filter in the Network > EventStream tab
- Tooltips with exemption reasons for third-party cookies in Network > Cookies
- Enable and disable all breakpoints in Sources
- View loaded scripts in DevTools for Node.js
- Lighthouse 11.5.0
- Accessibility improvements
- Miscellaneous highlights
- The official collection of Recorder extensions is live
- Network improvements
- Failure reason in the Status column
- Improved Copy submenu
- Performance improvements
- Breadcrumbs in the Timeline
- Event initiators in the Main track
- JavaScript VM instance selector menu for Node.js DevTools
- New shortcut and command in Sources
- Elements improvements
- The ::view-transition pseudo-element is now editable in Styles
- The align-content property support for block containers
- Posture support for emulated foldable devices
- Dynamic theming
- Third-party cookies phaseout warnings in the Network and Application panels
- Lighthouse 11.4.0
- Accessibility improvements
- Miscellaneous highlights
- Elements improvements
- Streamlined filter bar in the Network panel
@font-palette-valuessupport- Supported case: Custom property as a fallback of another custom property
- Improved source map support
- Performance panel improvements
- Enhanced Interactions track
- Advanced filtering in Bottom-Up, Call Tree, and Event Log tabs
- Indentation markers in the Sources panel
- Helpful tooltips for overridden headers and content in the Network panel
- New Command Menu options for adding and removing request blocking patterns
- The CSP violations experiment is removed
- Lighthouse 11.3.0
- Accessibility improvements
- Miscellaneous highlights
- Third-party cookie phaseout
- Analyze your website's cookies with the Privacy Sandbox Analysis Tool
- Enhanced ignore listing
- Default exclusion pattern for node_modules
- Caught exceptions now stop execution if caught or passing through non-ignored code
x_google_ignoreListrenamed toignoreListin source maps- New input mode toggle during remote debugging
- The Elements panel now shows URLs for #document nodes
- Effective Content Security Policy in the Application panel
- Improved animation debugging
- 'Do you trust this code?' dialog in Sources and self-XSS warning in Console
- Event listener breakpoints in web workers and worklets
- The new media badge for
<audio>and<video> - Preloading renamed to Speculative loading
- Lighthouse 11.2.0
- Accessibility improvements
- Miscellaneous highlights
- Improved @property section in Elements > Styles
- Editable @property rule
- Issues with invalid @property rules are reported
- Updated list of devices to emulate
- Pretty-print inline JSON in script tags in Sources
- Autocomplete private fields in Console
- Lighthouse 11.1.0
- Accessibility improvements
- Web SQL deprecation
- Screenshot aspect ratio validation in Application > Manifest
- Miscellaneous highlights
- New section for custom properties in Elements > Styles
- More local overrides improvements
- Enhanced search
- Improved Sources panel
- Streamlined workspace in the Sources panel
- Reorder panes in Sources
- Syntax highlighting and pretty-printing for more script types
- Emulate prefers-reduced-transparency media feature
- Lighthouse 11
- Accessibility improvements
- Miscellaneous highlights
- Network panel improvements
- Override web content locally even faster
- Override the content of XHR and fetch requests
- Hide Chrome extension requests
- Human-readable HTTP status codes
Performance: See the changes in fetch priority for network events
- Sources settings enabled by default: Code folding and automatic file reveal
- Improved debugging of third-party cookie issues
- New colors
- Lighthouse 10.4.0
- Debug preloading in the Application panel
- The C/C++ WebAssembly debugging extension for DevTools is now open source
- Miscellaneous highlights
- (Experimental) New rendering emulation: prefers-reduced-transparency
- (Experimental) Enhanced Protocol monitor
- Improved debugging of missing stylesheets
- Linear timing support in Elements > Styles > Easing Editor
- Storage buckets support and metadata view
- Lighthouse 10.3.0
- Accessibility: Keyboard commands and improved screen reading
- Miscellaneous highlights
- Elements improvements
- New CSS subgrid badge
- Selector specificity in tooltips
- Values of custom CSS properties in tooltips
- Sources improvements
- CSS syntax highlighting