
New features and changes coming to DevTools in Chrome 62:
- Support for top-level
awaitoperators in the Console. - Screenshots of a portion of the viewport, and screenshots of specific HTML nodes.
- CSS Grid highlighting.
- A new Console API for querying objects.
- Negative filters and URL filters in the Console.
- HAR imports in the Network panel.
- Previewable cache resources.
- More predictable cache debugging.
- Block-level code coverage.
Top-level await operators in the Console
The Console now supports top-level await operators.

Figure 1. Using top-level await operators in the Console
New screenshot workflows
You can now take a screenshot of a portion of the viewport, or of a specific HTML node.
Screenshots of a portion of the viewport
To take a screenshot of a portion of your viewport:
- Click Inspect
or press Command+Shift+C (Mac) or Control+Shift+C (Windows, Linux) to enter Inspect Element Mode.
- Hold Command (Mac) or Control (Windows, Linux) and select the portion of the viewport that you want to take a screenshot of.
- Release your mouse. DevTools downloads a screenshot of the portion that you selected.

Figure 2. Taking a screenshot of a portion of the viewport
Screenshots of specific HTML nodes
To take a screenshot of a specific HTML node:
Select an element in the Elements panel.
Figure 3. In this example, the goal is to take a screenshot of the blue header that contains the text
Tools. Note that this node is already selected in the DOM Tree of the Elements panelOpen the Command Menu.
Start typing
nodeand selectCapture node screenshot. DevTools downloads a screenshot of the selected node.Figure 4. The result of the
Capture node screenshotcommand


CSS Grid highlighting
To view the CSS Grid that's affecting an element, hover over an element in the DOM Tree of the
Elements panel. A dashed border appears around each of the grid items. This only works when the
selected item, or the parent of the selected item, has display:grid applied to it.

Figure 5. Highlighting a CSS Grid
Check out the video below to learn the basics of CSS Grid in less than 2 minutes.
A new API for querying heap objects
Call queryObjects(Constructor) from the Console to return an array of objects that were
created with the specified constructor. For example:
queryObjects(Promise). Returns all Promises.queryObjects(HTMLElement). Returns all HTML elements.queryObjects(foo), wherefoois a function name. Returns all objects that were instantiated vianew foo().
The scope of queryObjects() is the currently-selected execution context in the Console. See
Selecting execution context.
New Console filters
The Console now supports negative and URL filters.
Negative filters
Type -<text> in the Filter box to filter out any Console message that includes <text>.

Figure 6. The first statement logs one, two, three, and four to the Console. two
is hidden because -two is entered in the Filter box
DevTools filters out a message if <text> is found:
- In the message text.
- In the filename from which the message originated.
- In the stack trace text.
The negative filter also works with regular expressions such as -/[4-5]*ms/.
URL filters
Type url:<text> in the Filter box to only show messages that originated from a script whose
URL includes <text>.
The filter uses fuzzy matching. If <text> appears anywhere in the URL, then DevTools shows the
message.
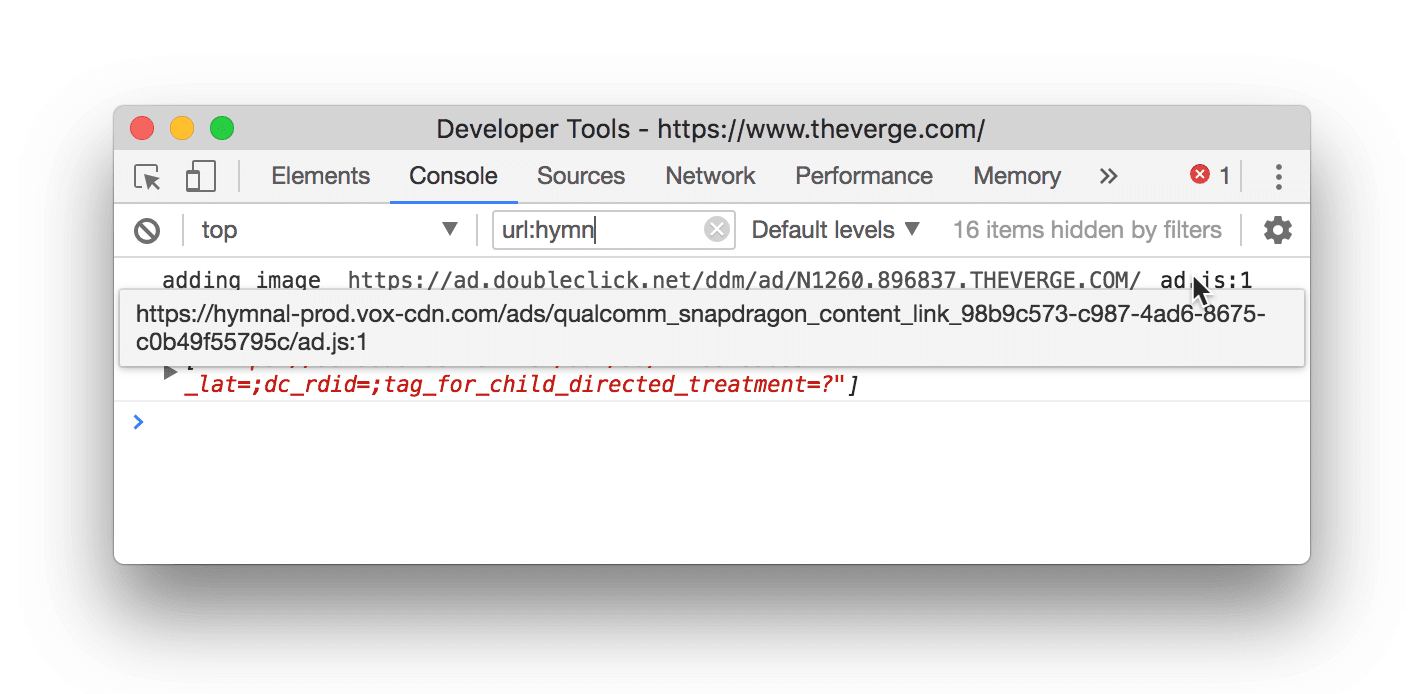
Figure 7. Using URL filtering to only display messages that originate from scripts whose URL
includes hymn. By hovering over the script name, you can see that the host name includes this text
HAR imports in the Network panel
Drag and drop a HAR file into the Network panel to import it.

Figure 8. Importing a HAR file
Previewable cache resources in the Application panel
Click a row in a Cache Storage table to see a preview of that resource below the table.

Figure 9. Previewing a cache resource
More responsive cache debugging
In Chrome 61 and earlier, debugging caches created with the Cache API is... rough. For example, when a page creates a new cache, you have to manually refresh the page or DevTools in order to see the new cache.
In Chrome 62, the Cache Storage tab now updates in real-time whenever you create, update, or delete a cache or a resource. Watch the video below for an example.
See the Cache Storage Demo to try it out yourself.
Block-level code coverage
In Chrome 61 and earlier, the Coverage tab marks all of the code within a function as used, so long as the function is called.

Figure 10. An example of the Coverage tab in Chrome 61. Line 4 is marked used, even though it never executes
Starting in Chrome 62, the Coverage tab now tells you which code within a function is called.

Figure 11. An example of the Coverage tab in Chrome 62. Line 4 is marked unused
Download the preview channels
Consider using the Chrome Canary, Dev, or Beta as your default development browser. These preview channels give you access to the latest DevTools features, let you test cutting-edge web platform APIs, and help you find issues on your site before your users do!
Get in touch with the Chrome DevTools team
Use the following options to discuss the new features, updates, or anything else related to DevTools.
- Submit feedback and feature requests to us at crbug.com.
- Report a DevTools issue using the More options > Help > Report a DevTools issue in DevTools.
- Tweet at @ChromeDevTools.
- Leave comments on What's new in DevTools YouTube videos or DevTools Tips YouTube videos.
What's new in DevTools
A list of everything that has been covered in the What's new in DevTools series.
- DevTools MCP server updates
- Improved trace sharing
- Support for @starting-style
- Editor widget for display: masonry
- Lighthouse 13
- Code suggestions from Gemini
- Enhancements for the DevTools MCP server
- Quicker access to AI assistance
- Debug the full performance trace with Gemini
- Toggle drawer orientation
- Google Developer Program
- Miscellaneous highlights
- Chrome DevTools (MCP) for your AI agent
- Debug the network dependency tree with Gemini
- Export your chats with Gemini
- Persisted track configuration in the Performance panel
- Filter IP protected network requests
- Elements > Layout tab adds masonry layout support
- Lighthouse 12.8.2
- Miscellaneous highlights
- Debug more insights with Gemini
- Emulate the 'Save-Data' header in 'Network conditions'
- See the Baseline status in a CSS property tooltip
- Override form factors in user agent client hints
- Lighthouse 12.8.0
- Miscellaneous highlights
- A more reliable and productive Chrome DevTools
- Upload images in AI assistance for styling
- Add request headers to the table in Network
- Check out the highlights from Google I/O 2025
- Miscellaneous highlights
- Performance panel improvements
- Preconnected origins in 'Network dependency tree' insight
- Server response and redirection times in 'Document request latency' insight
- Redirects in Summary of network requests
- Reduced noise in the performance trace
- Deprecated 'Disable JavaScript samples'
- Geolocation accuracy parameter in Sensors
- Elements panel improvements
- Debug complex CSS values easier
- @function support in Elements > Styles
- Network panel improvements
- has-request-header filter
- Direct Sockets in Isolated Web Apps
- Miscellaneous highlights
- Accessibility
- Google I/O 2025 edition
- Modify and save CSS changes to your workspace with Gemini
- Connect a workspace folder and save changes back to your source files
- Ask Gemini about performance insights
- Annotate performance findings with Gemini
- Add screenshots to your chats with Gemini
- New insights in the Performance panel
- Duplicated JavaScript
- Legacy JavaScript
- Speculations now support rule tags
- Lighthouse 12.6.0
- Miscellaneous highlights
- Accessibility
- Performance panel improvements
- New performance insights
- Click to highlight
- Server timings in Summary of network requests
- Filter cookies in 'Privacy and security'
- Sizes in kB units in tables across panels
- Autocomplete supports corner-shape and corner-*-shape in Elements > Styles
- Experimental: Highlighting issues with elements and attributes in DOM
- Lighthouse 12.5.0
- Miscellaneous highlights
- Performance panel improvements
- Origin and script links for profile and function calls in Performance
- LCP by phase field data support
- Network dependency tree insight
- Duration instead of total and self time in Summary
- Heaviest stack highlighting
- Improved empty states for various panels
- Accessibility tree view in Elements
- Lighthouse 12.4.0
- Miscellaneous highlights
- Privacy and security panel
- Performance panel improvements
- Calibrated CPU throttling presets
- Select different performance events in the same AI chat
- First- and third-party highlighting in Performance
- Field data in marker tooltips and insights
- Forced reflow insight
- 'Optimize DOM size' insight
- Extend the performance trace with console.timeStamp
- Elements panel improvements
- Real-time values of animated styles
- Support for :open pseudo-class and various pseudo-elements
- Copy all console messages
- Byte units in the Memory panel
- Miscellaneous highlights
- Persistent AI chat history
- Performance panel improvements
- Image delivery insight
- Classic and modern keyboard navigation
- Ignore irrelevant scripts in the flame chart
- Timeline marker and range highlighting on hover
- Recommended throttling settings
- Timings markers in an overlay
- Stack traces of JS calls in Summary
- Badge settings moved to menu in Elements
- New 'What's new' panel
- Lighthouse 12.3.0
- Miscellaneous highlights
- Debug network requests, source files, and performance traces with Gemini
- View AI chat history
- Manage extension storage in Application > Storage
- Performance improvements
- Interaction phases in live metrics
- Render blocking information in the Summary tab
- Support for scheduler.postTask events and their initiator arrows
- Animations panel and Elements > Styles tab improvements
- Jump from Elements > Styles to Animations
- Real-time updates in Computed tab
- Compute pressure emulation in Sensors
- JS objects with the same name grouped by source in the Memory panel
- A new look for settings
- Performance insights panel is deprecated and removed from DevTools
- Miscellaneous highlights
- Debug CSS with Gemini
- Control AI features in a dedicated settings tab
- Performance panel improvements
- Annotate and share performance findings
- Get performance insights right in the Performance panel
- Spot excessive layout shifts easier
- Spot the non-composited animations
- Hardware concurrency moves to Sensors
- Ignore anonymous scripts and focus on your code in stack traces
- Elements > Styles: Support for sideways-* writing modes for grid overlays and CSS-wide keywords
- Lighthouse audits for non-HTTP pages in timespan and snapshot modes
- Accessibility improvements
- Miscellaneous highlights
- Network panel improvements
- Network filters reimagined
- HAR exports now exclude sensitive data by default
- Elements panel improvements
- Autocomplete values for text-emphasis-* properties
- Scroll overflows marked with a badge
- Performance panel improvements
- Recommendations in live metrics
- Navigate breadcrumbs
- Memory panel improvements
- New 'Detached elements' profile
- Improved naming of plain JS objects
- Turn off dynamic theming
- Chrome Experiment: Process sharing
- Lighthouse 12.2.1
- Miscellaneous highlights
- Recorder supports export to Puppeteer for Firefox
- Performance panel improvements
- Live metrics observations
- Search requests in the Network track
- See stack traces of performance.mark and performance.measure calls
- Use test address data in the Autofill panel
- Elements panel improvements
- Force more states for specific elements
- Elements > Styles now autocompletes more grid properties
- Lighthouse 12.2.0
- Miscellaneous highlights
- Console insights by Gemini are going live in most European countries
- Performance panel updates
- Enhanced Network track
- Customize performance data with extensibility API
- Details in the Timings track
- Copy all listed requests in the Network panel
- Faster heap snapshots with named HTML tags and less clutter
- Open Animations panel to capture animations and edit @keyframes live
- Lighthouse 12.1.0
- Accessibility improvements
- Miscellaneous highlights
- Inspect CSS anchor positioning in the Elements panel
- Sources panel improvements
- Enhanced 'Never Pause Here'
- New scroll snap event listeners
- Network panel improvements
- Updated network throttling presets
- Service worker information in custom fields of the HAR format
- Send and receive WebSocket events in the Performance panel
- Miscellaneous highlights
- Performance panel improvements
- Move and hide tracks with updated track configuration mode
- Ignore scripts in the flame chart
- Throttle down the CPU by 20 times
- Performance insights panel will be deprecated
- Find excessive memory usage with new filters in heap snapshots
- Inspect storage buckets in Application > Storage
- Disable self-XSS warnings with a command-line flag
- Lighthouse 12.0.0
- Miscellaneous highlights
- Understand errors and warnings in the Console better with Gemini
- @position-try rules support in Elements > Styles
- Sources panel improvements
- Configure automatic pretty-printing and bracket closing
- Handled rejected promises are recognized as caught
- Error causes in the Console
- Network panel improvements
- Inspect Early Hints headers
- Hide the Waterfall column
- Performance panel improvements
- Capture CSS selector statistics
- Change order and hide tracks
- Ignore retainers in the Memory panel
- Lighthouse 11.7.1
- Miscellaneous highlights
- New Autofill panel
- Enhanced network throttling for WebRTC
- Scroll-driven animations support in the Animations panel
- Improved CSS nesting support in Elements > Styles
- Enhanced Performance panel
- Hide functions and their children in the flame chart
- Arrows from selected initiators to events they initiated
- Lighthouse 11.6.0
- Tooltips for special categories in Memory > Heap snapshots
- Application > Storage updates
- Bytes used for shared storage
- Web SQL is fully deprecated
- Coverage panel improvements
- The Layers panel might be deprecated
- JavaScript Profiler deprecation: Phase four, final
- Miscellaneous highlights
- Find the Easter egg
- Elements panel updates
- Emulate a focused page in Elements > Styles
- Color Picker, Angle Clock, and Easing Editor in
var()fallbacks - CSS length tool is deprecated
- Popover for the selected search result in the Performance > Main track
- Network panel updates
- Clear button and search filter in the Network > EventStream tab
- Tooltips with exemption reasons for third-party cookies in Network > Cookies
- Enable and disable all breakpoints in Sources
- View loaded scripts in DevTools for Node.js
- Lighthouse 11.5.0
- Accessibility improvements
- Miscellaneous highlights
- The official collection of Recorder extensions is live
- Network improvements
- Failure reason in the Status column
- Improved Copy submenu
- Performance improvements
- Breadcrumbs in the Timeline
- Event initiators in the Main track
- JavaScript VM instance selector menu for Node.js DevTools
- New shortcut and command in Sources
- Elements improvements
- The ::view-transition pseudo-element is now editable in Styles
- The align-content property support for block containers
- Posture support for emulated foldable devices
- Dynamic theming
- Third-party cookies phaseout warnings in the Network and Application panels
- Lighthouse 11.4.0
- Accessibility improvements
- Miscellaneous highlights
- Elements improvements
- Streamlined filter bar in the Network panel
@font-palette-valuessupport- Supported case: Custom property as a fallback of another custom property
- Improved source map support
- Performance panel improvements
- Enhanced Interactions track
- Advanced filtering in Bottom-Up, Call Tree, and Event Log tabs
- Indentation markers in the Sources panel
- Helpful tooltips for overridden headers and content in the Network panel
- New Command Menu options for adding and removing request blocking patterns
- The CSP violations experiment is removed
- Lighthouse 11.3.0
- Accessibility improvements
- Miscellaneous highlights
- Third-party cookie phaseout
- Analyze your website's cookies with the Privacy Sandbox Analysis Tool
- Enhanced ignore listing
- Default exclusion pattern for node_modules
- Caught exceptions now stop execution if caught or passing through non-ignored code
x_google_ignoreListrenamed toignoreListin source maps- New input mode toggle during remote debugging
- The Elements panel now shows URLs for #document nodes
- Effective Content Security Policy in the Application panel
- Improved animation debugging
- 'Do you trust this code?' dialog in Sources and self-XSS warning in Console
- Event listener breakpoints in web workers and worklets
- The new media badge for
<audio>and<video> - Preloading renamed to Speculative loading
- Lighthouse 11.2.0
- Accessibility improvements
- Miscellaneous highlights
- Improved @property section in Elements > Styles
- Editable @property rule
- Issues with invalid @property rules are reported