
New features coming to DevTools in Chrome 65 include:
- Local Overrides
- New accessibility tools
- The Changes tab
- New SEO and performance audits
- Multiple recordings in the Performance panel
- Reliable code stepping with workers and asynchronous code
Read on, or watch the video version of these release notes, below.
Local Overrides
Local Overrides let you make changes in DevTools, and keep those changes across page loads. Previously, any changes that you made in DevTools would be lost when you reloaded the page. Local Overrides work for most file types, with a couple of exceptions. See Limitations.
Figure 1. Persisting a CSS change across page loads with Local Overrides
How it works:
- You specify a directory where DevTools should save changes.
- When you make changes in DevTools, DevTools saves a copy of the modified file to your directory.
- When you reload the page, DevTools serves the local, modified file, rather than the network resource.
To set up Local Overrides:
- Open the Sources panel.
Open the Overrides tab.
Figure 2. The Overrides tab
Click Setup Overrides.
Select which directory you want to save your changes to.
At the top of your viewport, click Allow to give DevTools read and write access to the directory.
Make your changes.

Limitations
- DevTools doesn't save changes made in the DOM Tree of the Elements panel. Edit HTML in the Sources panel instead.
- If you edit CSS in the Styles pane, and the source of that CSS is an HTML file, DevTools won't save the change. Edit the HTML file in the Sources panel instead.
Related features
- Workspaces. DevTools automatically maps network resources to a local repository. Whenever you make a change in DevTools, that change gets saved to your local repository, too.
The Changes tab
Track changes that you make locally in DevTools via the new Changes tab.
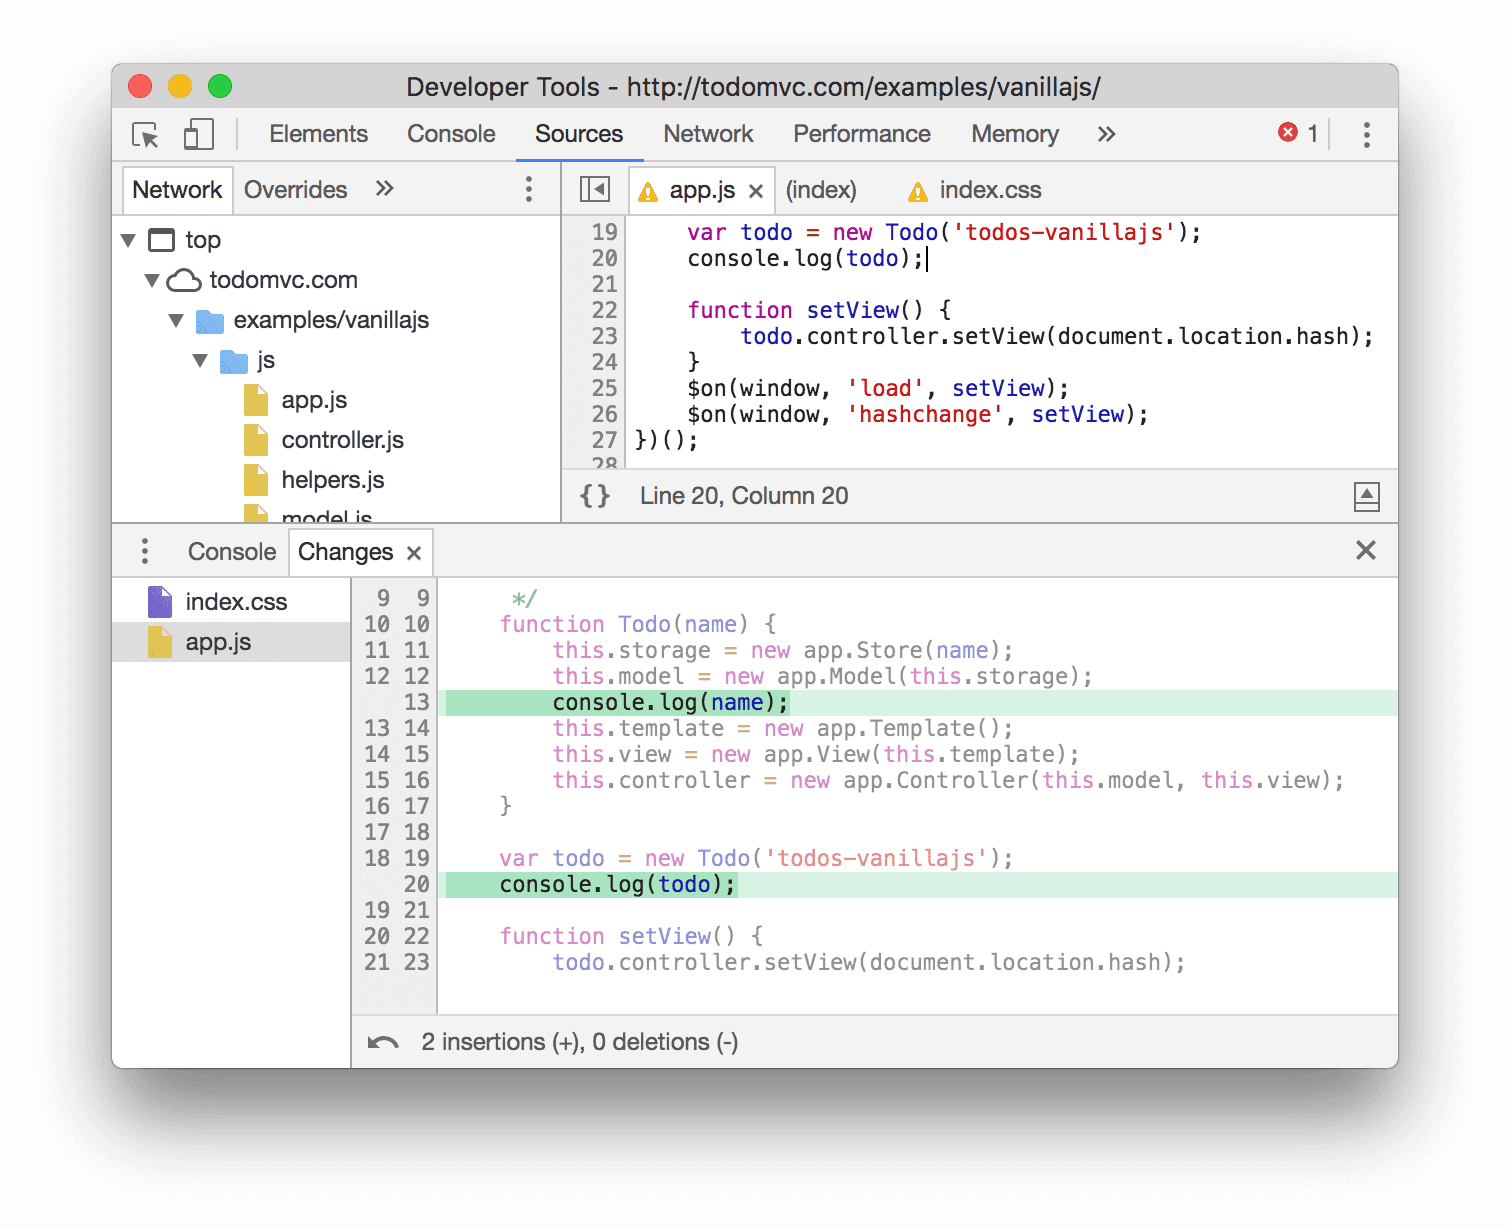
Figure 3. The Changes tab
New accessibility tools
Use the new Accessibility pane to inspect the accessibility properties of an element, and inspect the contrast ratio of text elements in the Color Picker to ensure that they're accessible to users with low-vision impairments or color-vision deficiencies.
Accessibility pane
Use the Accessibility pane on the Elements panel to investigate the accessibility properties of the currently-selected element.

Figure 4. The Accessibility pane shows the ARIA attributes and computed properties for the element that's currently selected in the DOM Tree on the Elements panel, as well as its position in the accessibility tree
Check out Rob Dodson's A11ycast on labeling below to see the Accessibility pane in action.
Contrast ratio in the Color Picker
The Color Picker now shows you the contrast ratio of text elements. Increasing the contrast ratio of text elements makes your site more accessible to users with low-vision impairments or color-vision deficiencies. See Color and contrast to learn more about how contrast ratio affects accessibility.
Improving the color contrast of your text elements makes your site more usable for all users. In other words, if your text is grey with a white background, that's hard for anyone to read.

Figure 5. Inspecting the contrast ratio of the highlighted h1 element
In Figure 5, the two checkmarks next to 4.61 means that this element meets the enhanced recommended contrast ratio (AAA). If it only had one checkmark, that would mean it met the minimum recommended contrast ratio (AA).
Click Show More to expand the Contrast
Ratio section. The white line in the Color Spectrum box represents the boundary between colors
that meet the recommended contrast ratio, and those that don't. For example, since the grey color in
Figure 6 meets recommendations, that means that all of the colors below the white line also meet
recommendations.

Figure 6. The expanded Contrast Ratio section
Related features
The Audits panel has an automated accessibility audit for ensuring that every text element on a page has a sufficient contrast ratio.
See Run Lighthouse in Chrome DevTools, or watch the A11ycast below, to learn how to use the Audits panel to test accessibility.
New audits
Chrome 65 ships with a whole new category of SEO audits, and many new performance audits.
New SEO audits
Ensuring that your pages pass each of the audits in the new SEO category may help improve your search engine rankings.

Figure 7. The new SEO category of audits
New performance audits
Chrome 65 also ships with many new performance audits:
- JavaScript boot-up time is high
- Uses inefficient cache policy on static assets
- Avoids page redirects
- Document uses plugins
- Minify CSS
- Minify JavaScript
Perf matters! After Mynet improved their page load speed by 4X, users spent 43% more time on the site, viewed 34% more pages, bounce rates dropped 24%, and revenue increased 25% per article pageview. Learn more.
Tip! If you want to improve the load performance of your pages, but don't know where to start, try the Audits panel. You give it a URL, and it gives you a detailed report on many different ways you can improve that page. Get started.
Other updates
- New, manual accessibility audits
- Updates to the WebP audit to make it more inclusive of other next-generation image formats
- A rehaul of the accessibility score
- If an accessibility audit is not applicable for a page, that audit no longer counts towards the accessibility score
- Performance is now the top section in reports
Reliable code stepping with workers and asynchronous code
Chrome 65 brings updates to the Step Into
button when stepping into
code that passes messages between threads, and asynchronous code. If you want the previous stepping
behavior, you can use the new Step
button, instead.
Stepping into code that passes messages between threads
When you step into code that passes messages between threads, DevTools now shows you what happens in each thread.
For example, the app in Figure 8 passes a message between the main thread and the worker thread.
After stepping into the postMessage() call on the main thread, DevTools pauses in the onmessage
handler in the worker thread. The onmessage handler itself posts a message back to the main
thread. Stepping into that call pauses DevTools back in the main thread.
Figure 8. Stepping into message-passing code in Chrome 65
When you stepped into code like this in earlier versions of Chrome, Chrome only showed you the main-thread-side of the code, as you can see in Figure 9.
Figure 9. Stepping into message-passing code in Chrome 63
Stepping into asynchronous code
When stepping into asynchronous code, DevTools now assumes that you want to pause in the the asynchronous code that eventually runs.
For example, in Figure 10 after stepping into setTimeout(), DevTools runs all of the code
leading up to that point behind the scenes, and then pauses in the function that's passed to
setTimeout().
Figure 10. Stepping into asynchronous code in Chrome 65
When you stepped into code like this in Chrome 63, DevTools paused in code as it chronologically ran, as you can see in Figure 11.
Figure 11. Stepping into asynchronous code in Chrome 63
Multiple recordings in the Performance panel
The Performance panel now lets you temporarily save up to 5 recordings. The recordings are deleted when you close your DevTools window. See Get Started with Analyzing Runtime Performance to get comfortable with the Performance panel.

Figure 12. Selecting between multiple recordings in the Performance panel
Bonus: Automate DevTools actions with Puppeteer 1.0
Version 1.0 of Puppeteer, a browser automation tool maintained by the Chrome DevTools team, is now out. You can use Puppeteer to automate many tasks that were previously only available via DevTools, such as capturing screenshots:
const puppeteer = require('puppeteer');
(async () => {
  const browser = await puppeteer.launch();
  const page = await browser.newPage();
  await page.goto('https://example.com');
  await page.screenshot({path: 'example.png'});
  await browser.close();
})();
It also has APIs for lots of generally useful automation tasks, such as generating PDFs:
const puppeteer = require('puppeteer');
(async () => {
  const browser = await puppeteer.launch();
  const page = await browser.newPage();
  await page.goto('https://news.ycombinator.com', {waitUntil: 'networkidle2'});
  await page.pdf({path: 'hn.pdf', format: 'A4'});
  await browser.close();
})();
See Quick Start to learn more.
You can also use Puppeteer to expose DevTools features while browsing without ever explicitly opening DevTools. See Using DevTools Features Without Opening DevTools for an example.
Download the preview channels
Consider using the Chrome Canary, Dev, or Beta as your default development browser. These preview channels give you access to the latest DevTools features, let you test cutting-edge web platform APIs, and help you find issues on your site before your users do!
Get in touch with the Chrome DevTools team
Use the following options to discuss the new features, updates, or anything else related to DevTools.
- Submit feedback and feature requests to us at crbug.com.
- Report a DevTools issue using the More options > Help > Report a DevTools issue in DevTools.
- Tweet at @ChromeDevTools.
- Leave comments on What's new in DevTools YouTube videos or DevTools Tips YouTube videos.
What's new in DevTools
A list of everything that has been covered in the What's new in DevTools series.
- DevTools MCP server updates
- Improved trace sharing
- Support for @starting-style
- Editor widget for display: masonry
- Lighthouse 13
- Code suggestions from Gemini
- Enhancements for the DevTools MCP server
- Quicker access to AI assistance
- Debug the full performance trace with Gemini
- Toggle drawer orientation
- Google Developer Program
- Miscellaneous highlights
- Chrome DevTools (MCP) for your AI agent
- Debug the network dependency tree with Gemini
- Export your chats with Gemini
- Persisted track configuration in the Performance panel
- Filter IP protected network requests
- Elements > Layout tab adds masonry layout support
- Lighthouse 12.8.2
- Miscellaneous highlights
- Debug more insights with Gemini
- Emulate the 'Save-Data' header in 'Network conditions'
- See the Baseline status in a CSS property tooltip
- Override form factors in user agent client hints
- Lighthouse 12.8.0
- Miscellaneous highlights
- A more reliable and productive Chrome DevTools
- Upload images in AI assistance for styling
- Add request headers to the table in Network
- Check out the highlights from Google I/O 2025
- Miscellaneous highlights
- Performance panel improvements
- Preconnected origins in 'Network dependency tree' insight
- Server response and redirection times in 'Document request latency' insight
- Redirects in Summary of network requests
- Reduced noise in the performance trace
- Deprecated 'Disable JavaScript samples'
- Geolocation accuracy parameter in Sensors
- Elements panel improvements
- Debug complex CSS values easier
- @function support in Elements > Styles
- Network panel improvements
- has-request-header filter
- Direct Sockets in Isolated Web Apps
- Miscellaneous highlights
- Accessibility
- Google I/O 2025 edition
- Modify and save CSS changes to your workspace with Gemini
- Connect a workspace folder and save changes back to your source files
- Ask Gemini about performance insights
- Annotate performance findings with Gemini
- Add screenshots to your chats with Gemini
- New insights in the Performance panel
- Duplicated JavaScript
- Legacy JavaScript
- Speculations now support rule tags
- Lighthouse 12.6.0
- Miscellaneous highlights
- Accessibility
- Performance panel improvements
- New performance insights
- Click to highlight
- Server timings in Summary of network requests
- Filter cookies in 'Privacy and security'
- Sizes in kB units in tables across panels
- Autocomplete supports corner-shape and corner-*-shape in Elements > Styles
- Experimental: Highlighting issues with elements and attributes in DOM
- Lighthouse 12.5.0
- Miscellaneous highlights
- Performance panel improvements
- Origin and script links for profile and function calls in Performance
- LCP by phase field data support
- Network dependency tree insight
- Duration instead of total and self time in Summary
- Heaviest stack highlighting
- Improved empty states for various panels
- Accessibility tree view in Elements
- Lighthouse 12.4.0
- Miscellaneous highlights
- Privacy and security panel
- Performance panel improvements
- Calibrated CPU throttling presets
- Select different performance events in the same AI chat
- First- and third-party highlighting in Performance
- Field data in marker tooltips and insights
- Forced reflow insight
- 'Optimize DOM size' insight
- Extend the performance trace with console.timeStamp
- Elements panel improvements
- Real-time values of animated styles
- Support for :open pseudo-class and various pseudo-elements
- Copy all console messages
- Byte units in the Memory panel
- Miscellaneous highlights
- Persistent AI chat history
- Performance panel improvements
- Image delivery insight
- Classic and modern keyboard navigation
- Ignore irrelevant scripts in the flame chart
- Timeline marker and range highlighting on hover
- Recommended throttling settings
- Timings markers in an overlay
- Stack traces of JS calls in Summary
- Badge settings moved to menu in Elements
- New 'What's new' panel
- Lighthouse 12.3.0
- Miscellaneous highlights
- Debug network requests, source files, and performance traces with Gemini
- View AI chat history
- Manage extension storage in Application > Storage
- Performance improvements
- Interaction phases in live metrics
- Render blocking information in the Summary tab
- Support for scheduler.postTask events and their initiator arrows
- Animations panel and Elements > Styles tab improvements
- Jump from Elements > Styles to Animations
- Real-time updates in Computed tab
- Compute pressure emulation in Sensors
- JS objects with the same name grouped by source in the Memory panel
- A new look for settings
- Performance insights panel is deprecated and removed from DevTools
- Miscellaneous highlights
- Debug CSS with Gemini
- Control AI features in a dedicated settings tab
- Performance panel improvements
- Annotate and share performance findings
- Get performance insights right in the Performance panel
- Spot excessive layout shifts easier
- Spot the non-composited animations
- Hardware concurrency moves to Sensors
- Ignore anonymous scripts and focus on your code in stack traces
- Elements > Styles: Support for sideways-* writing modes for grid overlays and CSS-wide keywords
- Lighthouse audits for non-HTTP pages in timespan and snapshot modes
- Accessibility improvements
- Miscellaneous highlights
- Network panel improvements
- Network filters reimagined
- HAR exports now exclude sensitive data by default
- Elements panel improvements
- Autocomplete values for text-emphasis-* properties
- Scroll overflows marked with a badge
- Performance panel improvements
- Recommendations in live metrics
- Navigate breadcrumbs
- Memory panel improvements
- New 'Detached elements' profile
- Improved naming of plain JS objects
- Turn off dynamic theming
- Chrome Experiment: Process sharing
- Lighthouse 12.2.1
- Miscellaneous highlights
- Recorder supports export to Puppeteer for Firefox
- Performance panel improvements
- Live metrics observations
- Search requests in the Network track
- See stack traces of performance.mark and performance.measure calls
- Use test address data in the Autofill panel
- Elements panel improvements
- Force more states for specific elements
- Elements > Styles now autocompletes more grid properties
- Lighthouse 12.2.0
- Miscellaneous highlights
- Console insights by Gemini are going live in most European countries
- Performance panel updates
- Enhanced Network track
- Customize performance data with extensibility API
- Details in the Timings track
- Copy all listed requests in the Network panel
- Faster heap snapshots with named HTML tags and less clutter
- Open Animations panel to capture animations and edit @keyframes live
- Lighthouse 12.1.0
- Accessibility improvements
- Miscellaneous highlights
- Inspect CSS anchor positioning in the Elements panel
- Sources panel improvements
- Enhanced 'Never Pause Here'
- New scroll snap event listeners
- Network panel improvements
- Updated network throttling presets
- Service worker information in custom fields of the HAR format
- Send and receive WebSocket events in the Performance panel
- Miscellaneous highlights
- Performance panel improvements
- Move and hide tracks with updated track configuration mode
- Ignore scripts in the flame chart
- Throttle down the CPU by 20 times
- Performance insights panel will be deprecated
- Find excessive memory usage with new filters in heap snapshots
- Inspect storage buckets in Application > Storage
- Disable self-XSS warnings with a command-line flag
- Lighthouse 12.0.0
- Miscellaneous highlights
- Understand errors and warnings in the Console better with Gemini
- @position-try rules support in Elements > Styles
- Sources panel improvements
- Configure automatic pretty-printing and bracket closing
- Handled rejected promises are recognized as caught
- Error causes in the Console
- Network panel improvements
- Inspect Early Hints headers
- Hide the Waterfall column
- Performance panel improvements
- Capture CSS selector statistics
- Change order and hide tracks
- Ignore retainers in the Memory panel
- Lighthouse 11.7.1
- Miscellaneous highlights
- New Autofill panel
- Enhanced network throttling for WebRTC
- Scroll-driven animations support in the Animations panel
- Improved CSS nesting support in Elements > Styles
- Enhanced Performance panel
- Hide functions and their children in the flame chart
- Arrows from selected initiators to events they initiated
- Lighthouse 11.6.0
- Tooltips for special categories in Memory > Heap snapshots
- Application > Storage updates
- Bytes used for shared storage
- Web SQL is fully deprecated
- Coverage panel improvements
- The Layers panel might be deprecated
- JavaScript Profiler deprecation: Phase four, final
- Miscellaneous highlights
- Find the Easter egg
- Elements panel updates
- Emulate a focused page in Elements > Styles
- Color Picker, Angle Clock, and Easing Editor in
var()fallbacks - CSS length tool is deprecated
- Popover for the selected search result in the Performance > Main track
- Network panel updates
- Clear button and search filter in the Network > EventStream tab
- Tooltips with exemption reasons for third-party cookies in Network > Cookies
- Enable and disable all breakpoints in Sources
- View loaded scripts in DevTools for Node.js
- Lighthouse 11.5.0
- Accessibility improvements
- Miscellaneous highlights
- The official collection of Recorder extensions is live
- Network improvements
- Failure reason in the Status column
- Improved Copy submenu
- Performance improvements
- Breadcrumbs in the Timeline
- Event initiators in the Main track
- JavaScript VM instance selector menu for Node.js DevTools