
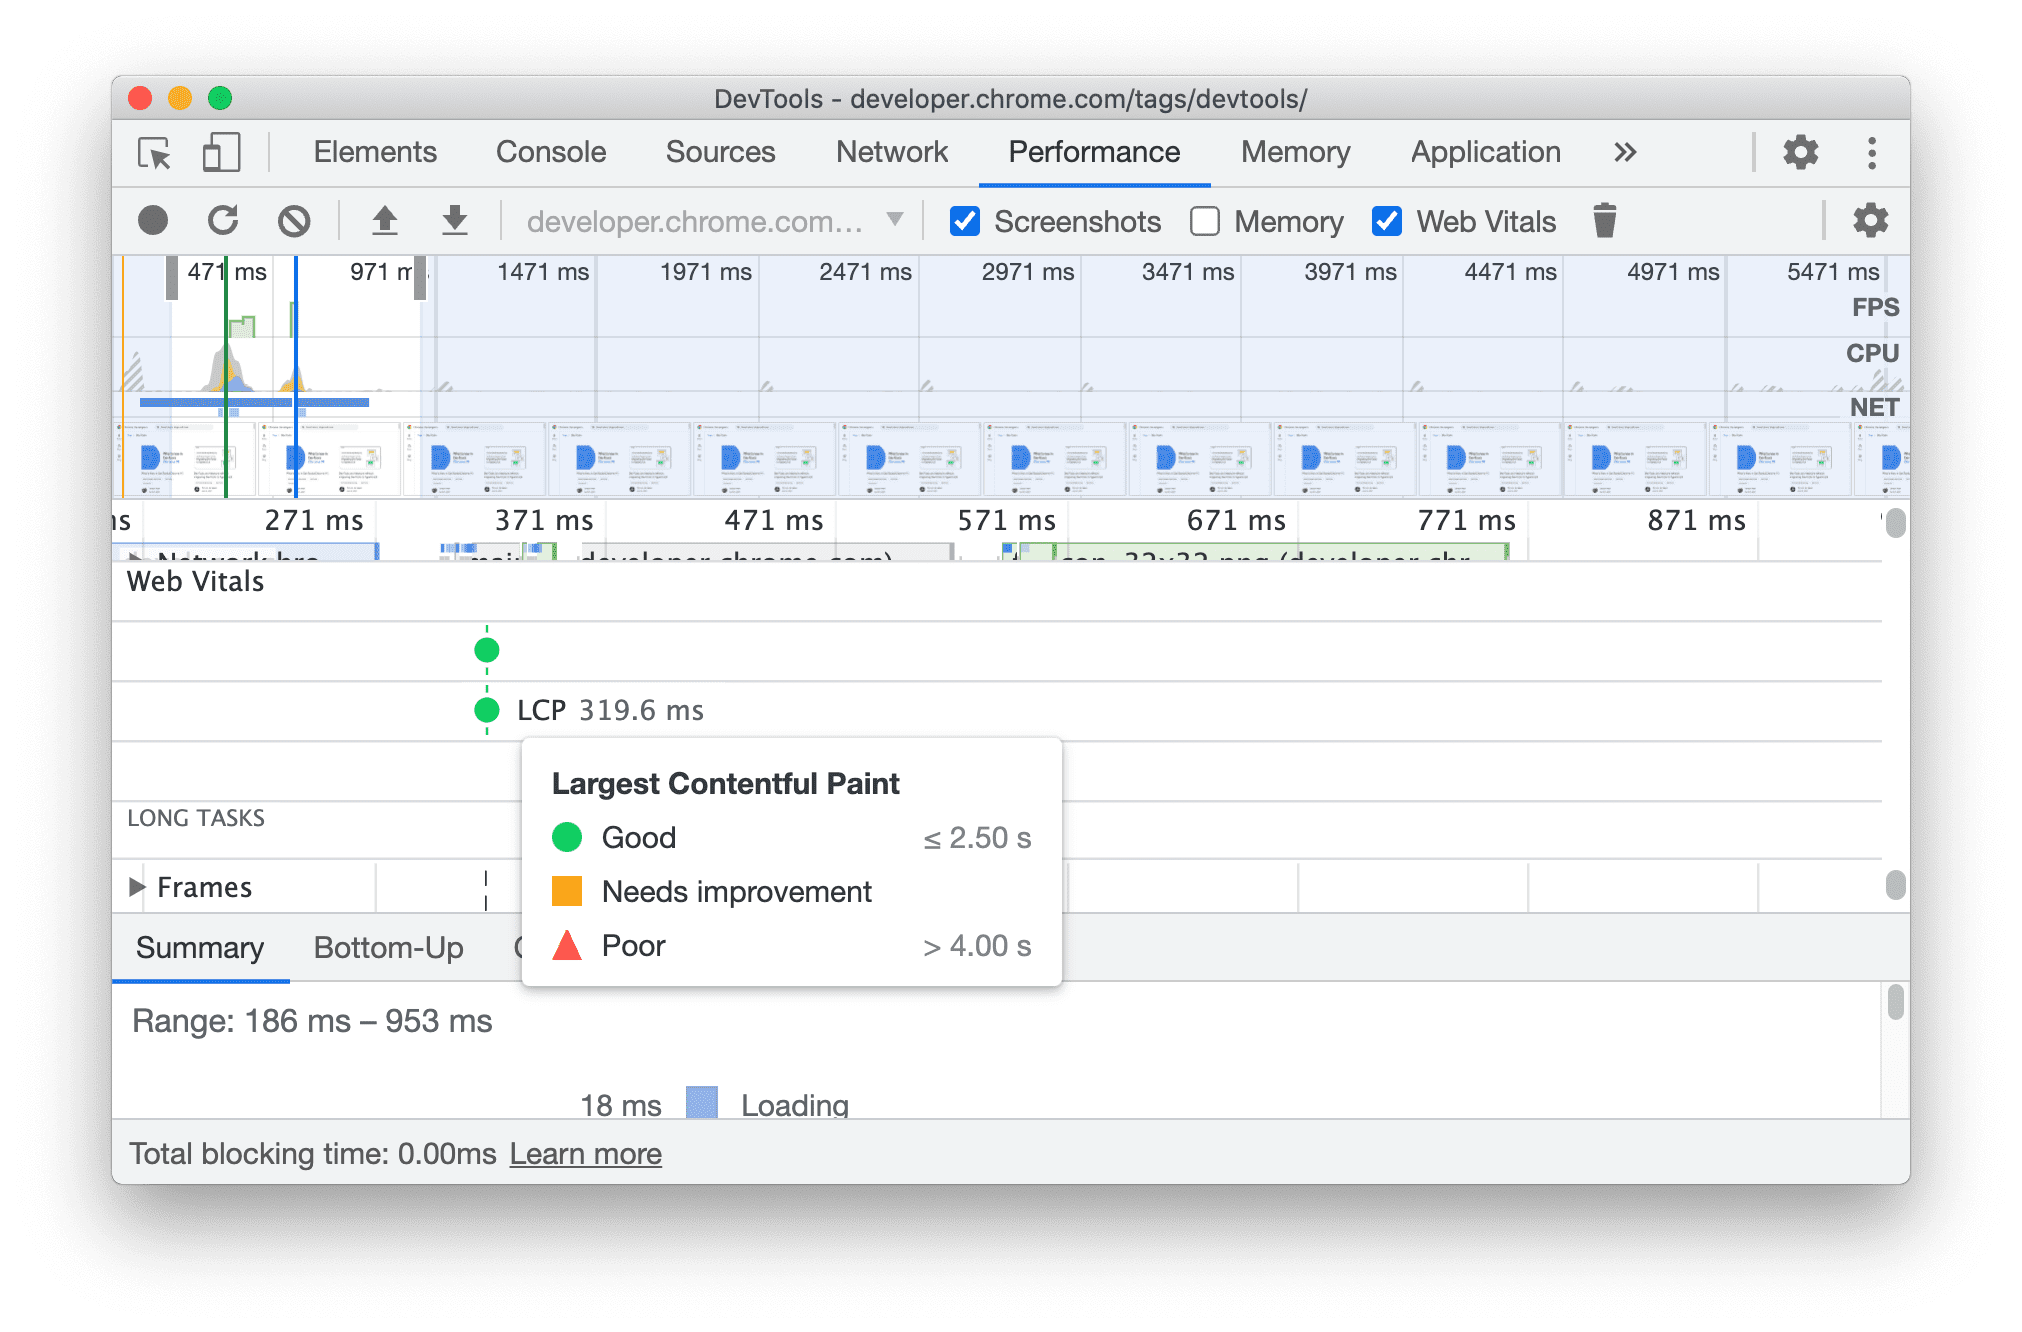
Web Vitals information pop up in the Performance panel
Hover on a Web Vitals marker in the Performance panel to understand what's the indicator about - whether the performance is good, needs improvement, or poor.
Chromium issue: 1147872
Visualize CSS scroll-snap
You can now toggle the scroll-snap badge in the Elements panel to inspect the CSS scroll-snap alignment.
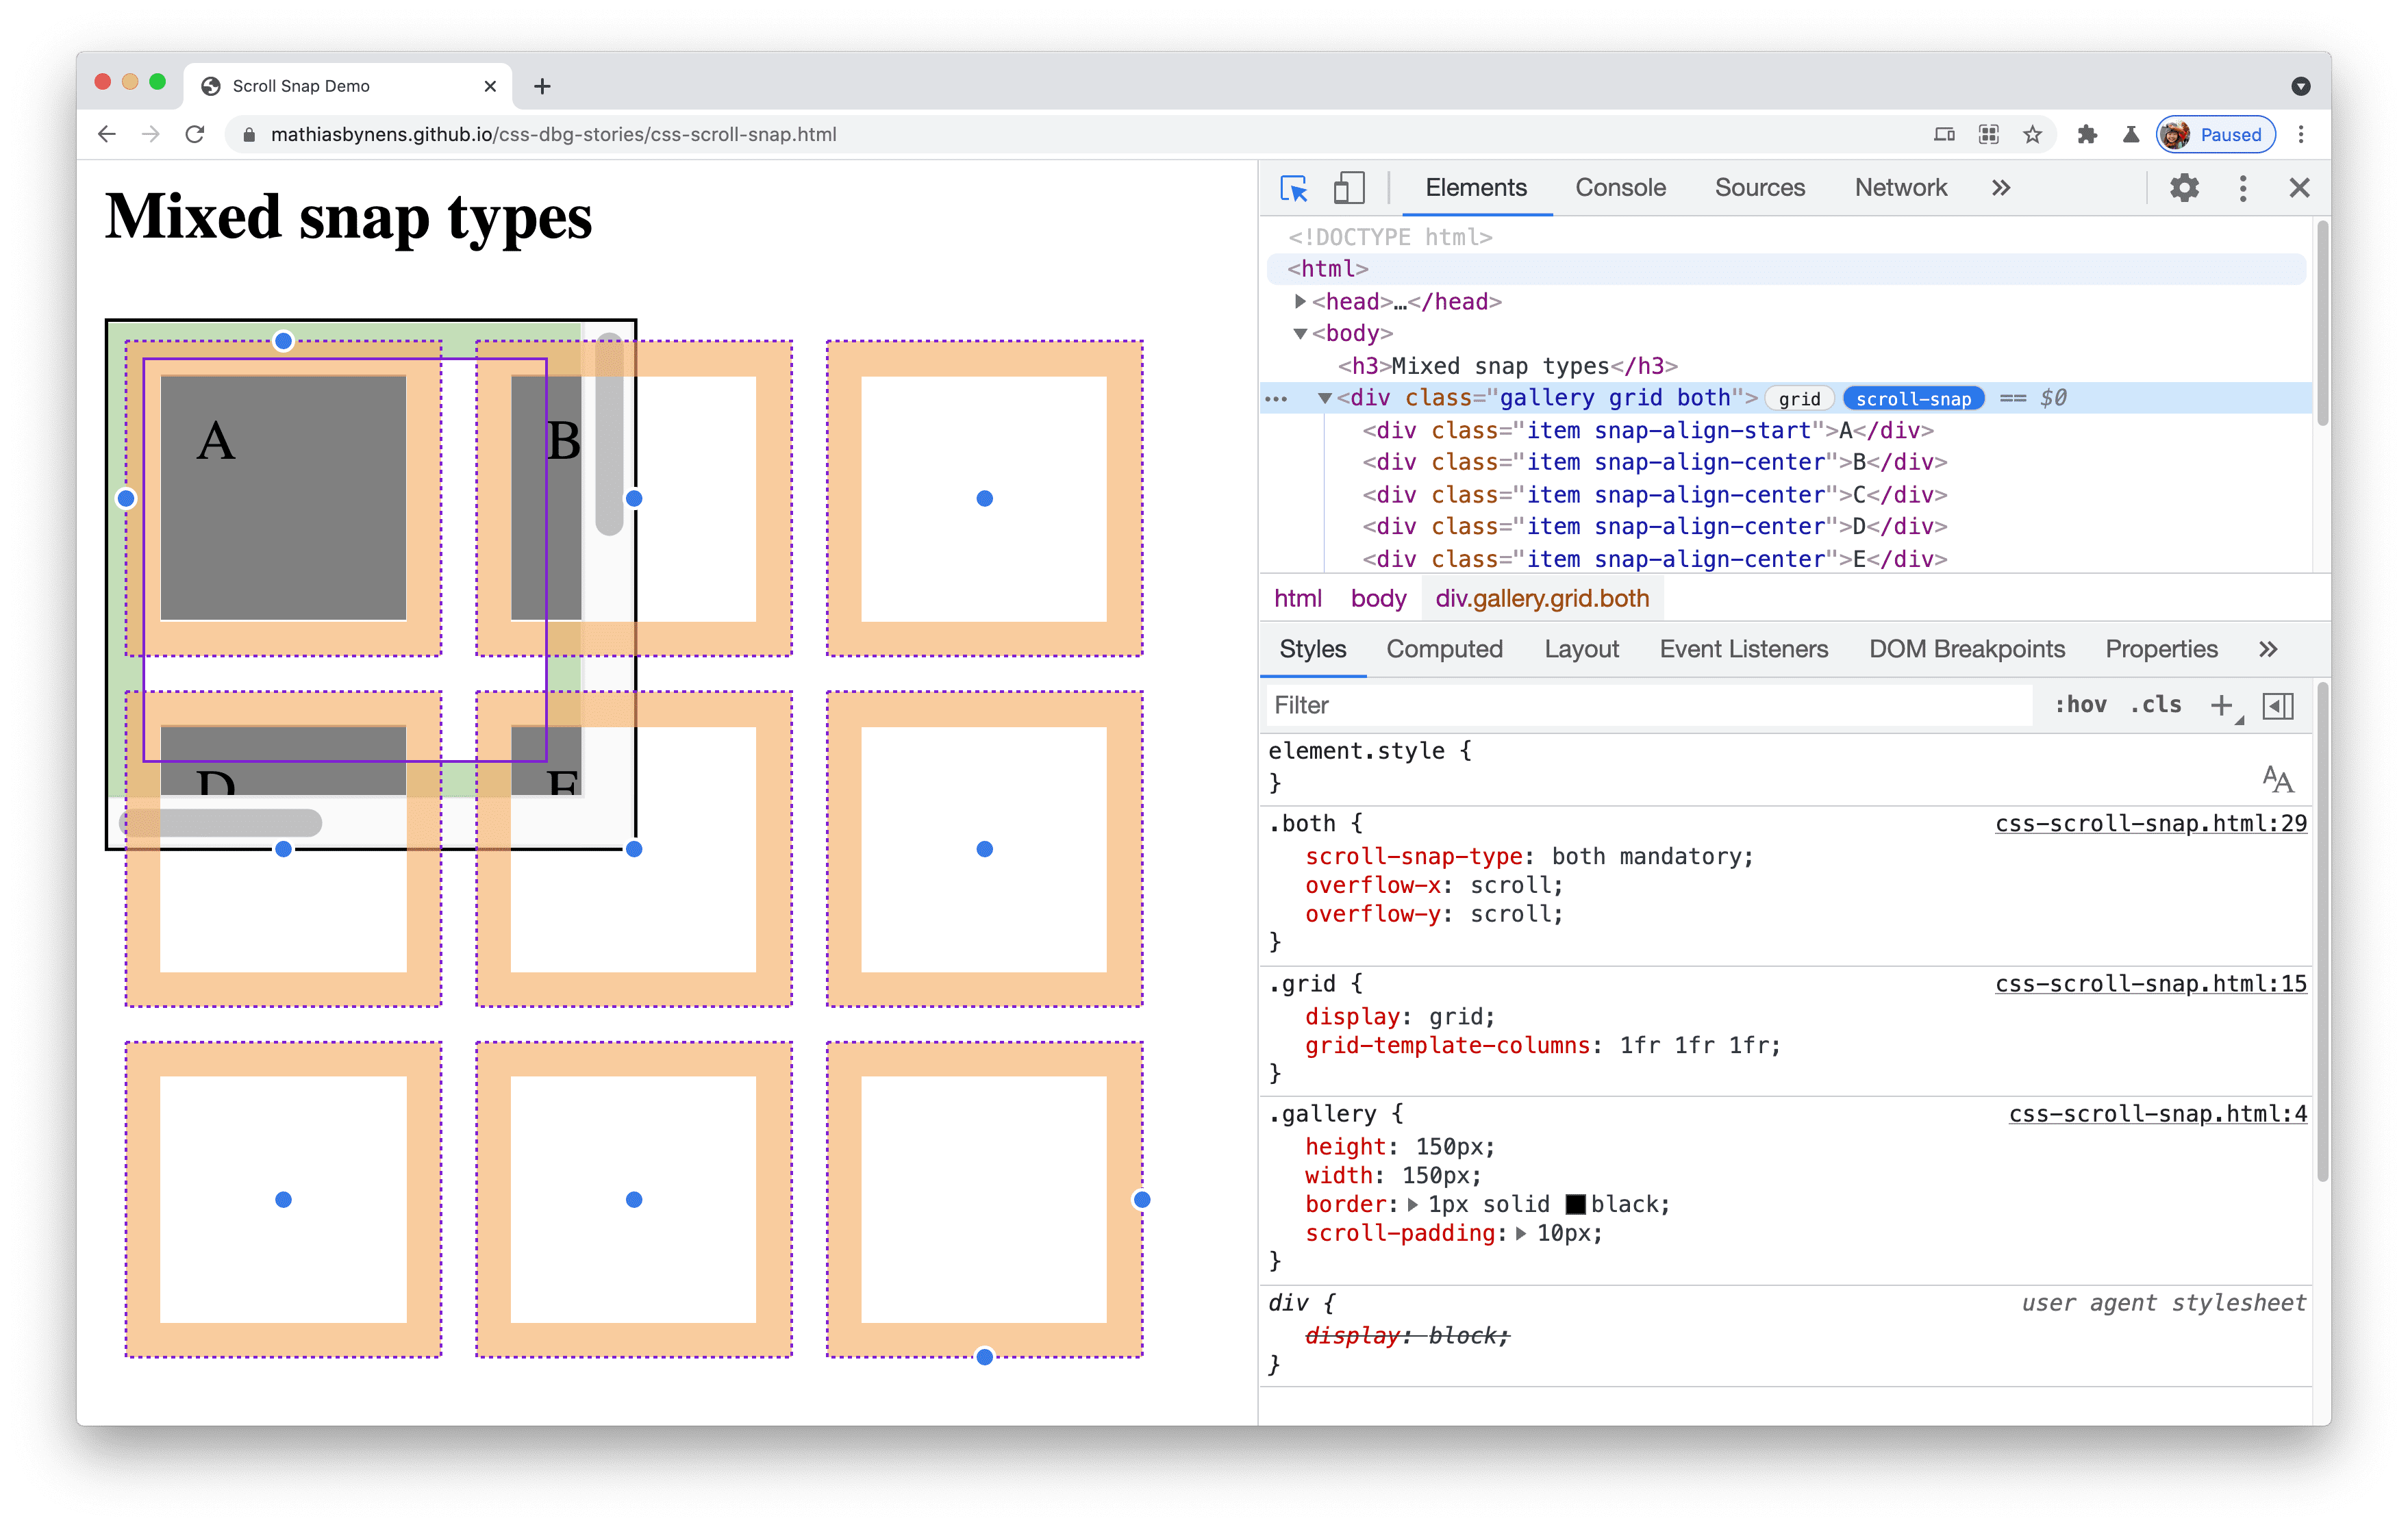
When an HTML element on your page (e.g. this demo page) has scroll-snap-type applied to it, you can see a scroll-snap badge next to it in the Elements panel. Click the badge to toggle the display of a scroll-snap overlay on the page.
In the example above, you can see dot marks on snap edges. The scroll port has solid outlined while the snap items have dash outlines. The scroll padding is filled in green color while the scroll margin is filled in orange.
Chromium issue: 862450
New Memory inspector
Use the new Memory inspector to inspect an ArrayBuffer in JavaScript, as well as the Wasm memory.
Open this demo page. In the Sources panel, open the demo-js.js file, and set a breakpoint at line 18.
Refresh the page. Expand the Scope section in the right debugger pane. Notice the new icon next to the buffer value. Click on it to reveal the Memory Inspector.
Check out the documentation to learn more about inspecting JavaScript ArrayBuffer and WebAssembly.Memory with this new Memory inspector.

Chromium issue: 1166577
New badge settings pane in the Elements panel
You can now selectively enable or disable badges via the Badge settings in the Elements panel. Use this feature to customize and stay focused on the important badges while inspecting web pages.
In the Elements panel, right click on any elements. Select Badge settings from the context menu, the badge settings pane appears on top. Enable or disable any checkbox to show/hide the badges.
Chromium issue: 1066772
Enhanced image preview with aspect ratio information
Image previews in the Elements panel now displays more information on the image - rendered size, rendered aspect ratio, intrinsic size, intrinsic aspect ratio, and file size.
This information helps you better understand your images and apply optimization if you need to.

The image aspect ratio information is available in the Network panel as well when you click to preview the image.

Chromium issues: 1149832, 1170656
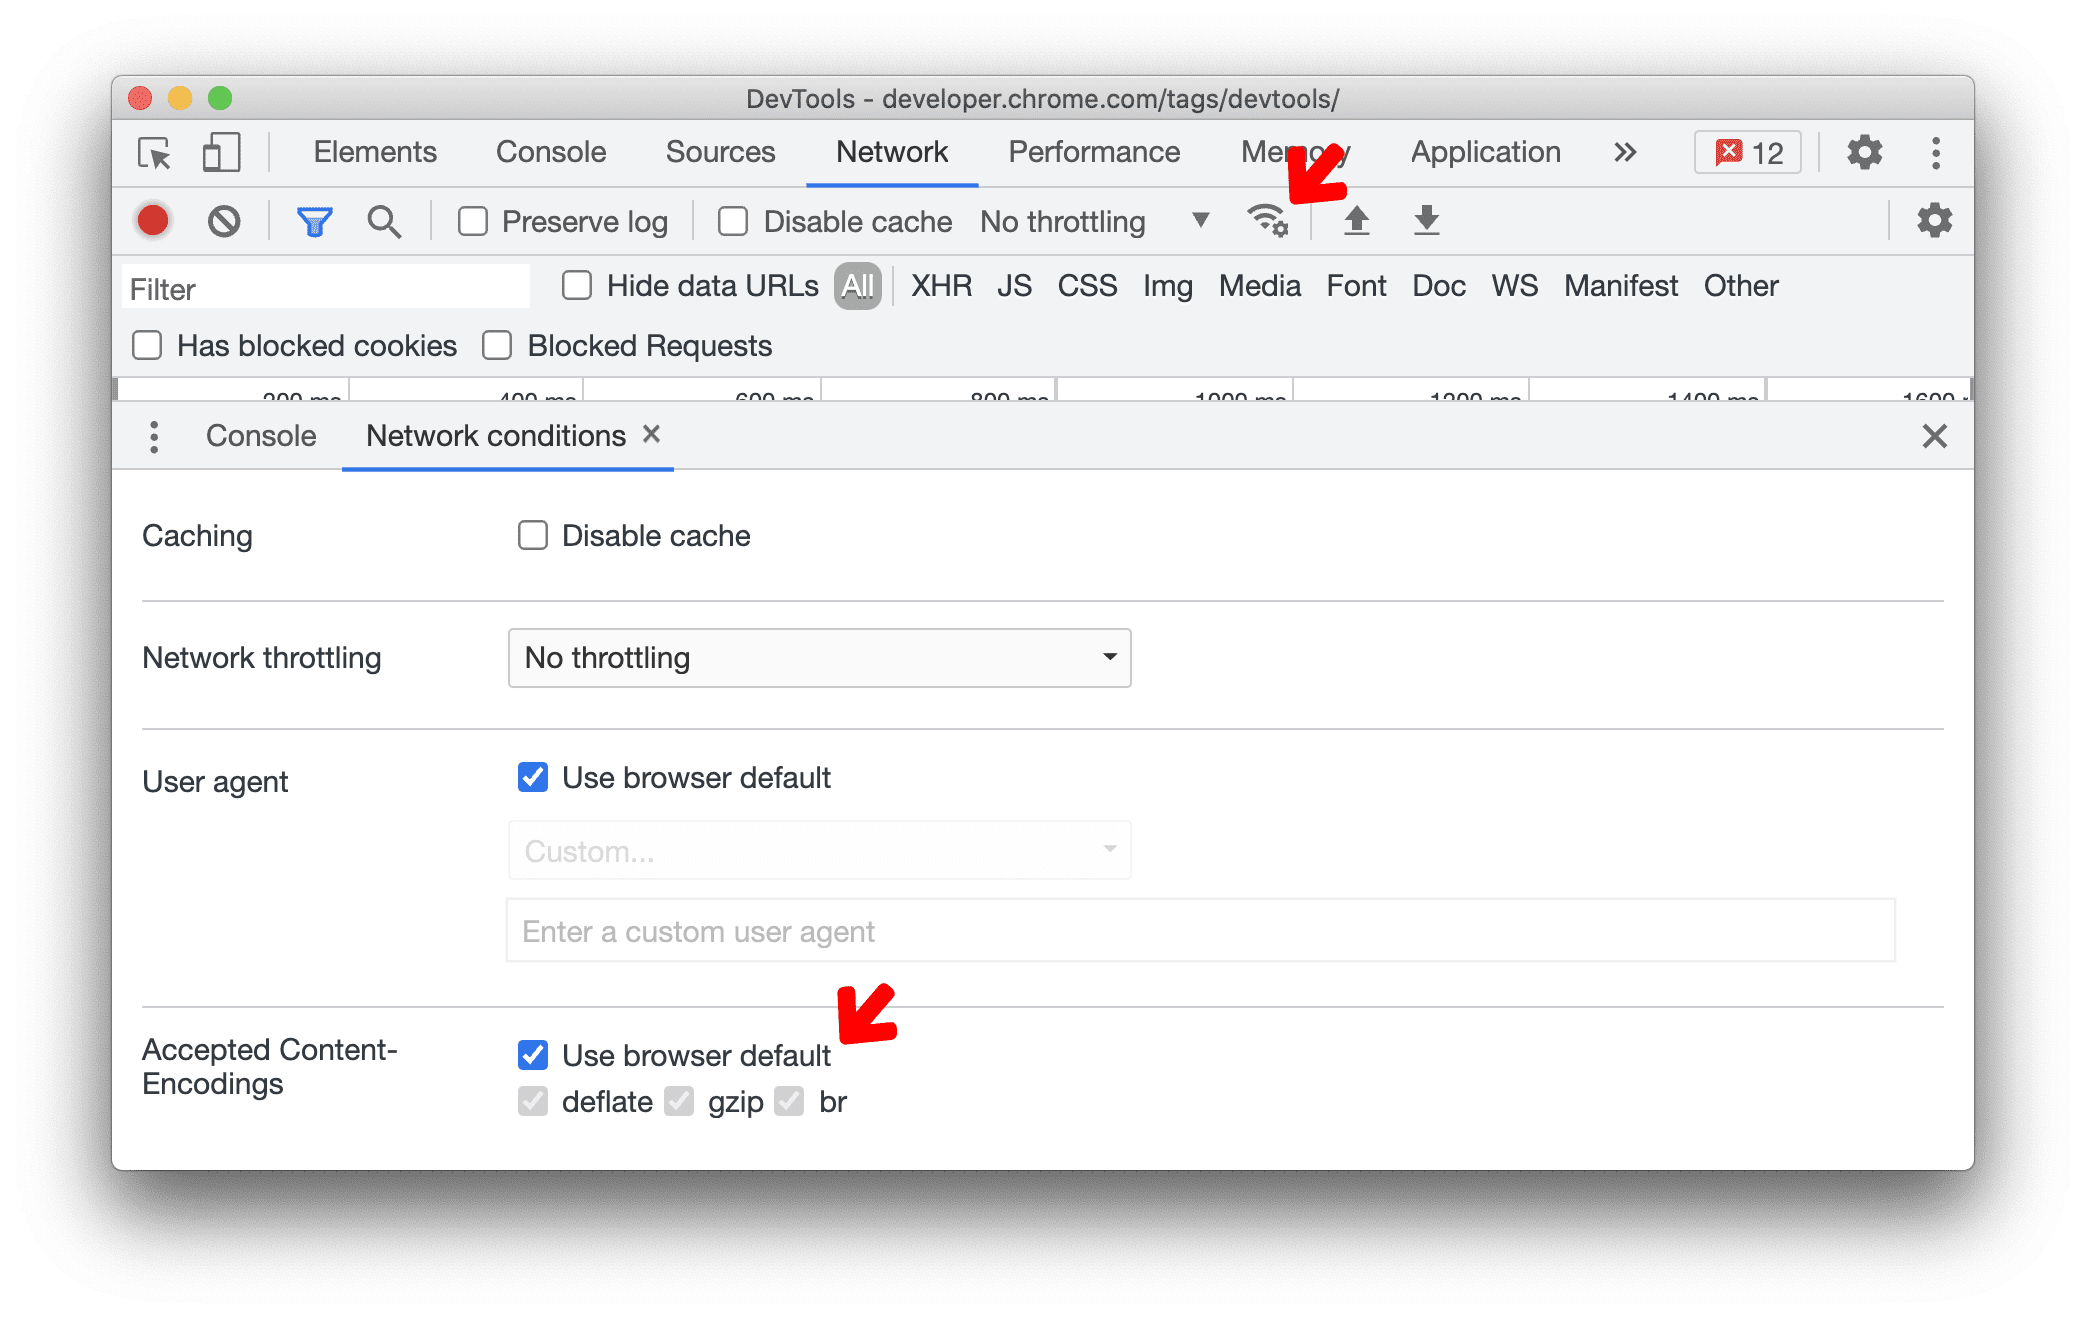
New network conditions button with options to configure Content-Encodings
A new network conditions button is added in the Network panel. Click on it to open the Network conditions tab.
A new Accepted Content-Encodings option is added to the Network conditions tab. Configure it to test if server responses are encoded correctly in browsers that do not support gzip, brotli, or other future Content-Encodings.
Chromium issue: 1162042
Styles pane enhancements
New shortcut to view computed value in the Styles pane
You can now right click on a CSS property in the Styles pane and select View computed value to view the computed CSS value.

Chromium issue: 1076198
Support for the accent-color keyword
The Styles pane's autocomplete UI now detects the accent-color CSS keyword, which allows web developers to specify the accent color for UI controls (e.g. checkbox, radio button) generated by the element.
The accent-color CSS property is currently experimental. Please enable chrome://flags/#enable-experimental-web-platform-features to test it.

Chromium issue: 1092093
Categorize issue types with colors and icons
The Issues tab now categorize issues into page errors, upcoming breaking changes, and possible improvements for better severity indication. You can open the Issues tab by clicking on the issue count button in the Console.
- Page errors (red). Issues that have immediate impact for page functionality, such as not setting correct CORS headers, etc.
- Upcoming breaking changes (yellow). Issues that inform about an upcoming, incompatible change of the web platform that may result in a loss of page functionality (e.g. warning of upcoming CORS RFC 1918 changes).
- Possible improvements (blue). Potential improvements on the page, but are currently not impairing basic functionality of the page (e.g. accessibility issues)

Chromium issue: 1183241
Delete Trust tokens
You can now delete trust tokens with the new delete button in the Trust tokens pane, under the Application panel.
Trust Token is a new API to help combat fraud and distinguish bots from real humans, without passive tracking. Learn how to get started with Trust Tokens.

Chromium issue: 1126824
View details on blocked features in the Frame details view
You can now view details on blocked features under the Permissions policy section in the Frame details view.
Open this demo page. Go to the Application panel and select a frame. In the Permissions Policy section, scroll to the Disabled Features property. Click on Show details to view the details on why the feature is blocked. Click on the icon next to each policy to navigate to the iframe or network request that blocked the feature.
Permissions policy is a web platform API which gives a website the ability to allow or block the use of browser features in its own frame or in iframes that it embeds.

Chromium issue: 1158827
Filter experiments in the Experiments setting
Find experiments quicker with the new experiment filter. For example, go to Settings > Experiments, in the Filter textbox, type "contrast" to filter all the experiments with the word "contrast".

New Vary Header column in the Cache storage pane
Use the new Vary Header column in the Cache Storage pane to view the Vary HTTP response header.

Chromium issue: 1186049
Sources panel improvements
Support for new JavaScript features
DevTools now support the new private brand check JavaScript language feature, a.k.a #foo in obj.
This private brand checks feature extends the in operator to support the private class fields testing on any given object.
Try it out in the Console and Sources panel. You can inspect the private fields in the Scope section under the debugger pane as well.

Chromium issue: 11374
Enhanced support for breakpoints debugging
DevTools now properly set breakpoints in multiple scripts correctly. Modern JavaScript bundlers (e.g. Webpack, Rollup) support code splitting feature - there are scenarios where one shared component can be included in multiple routes (code splits).
Previously, DevTools was only able to set breakpoints on one raw location. With this latest improvement, DevTools can set breakpoints in all relevant locations correctly.
Chromium issues: 1142705, 979000, 1180794
Support hover preview with [] notation
DevTools now support for hover preview on JavaScript member expressions that use the [] notation in the Sources panel.
![Support hover preview with '[]' notation](https://developer.chrome.com/static/blog/new-in-devtools-91/image/support-hover-preview-b4da984a268c5_2880.png)
Chromium issue: 1178305
Improved outline of HTML files
DevTools now has better outline support for HTML files. In the Sources panel, open a HTML file. You can toggle the code outline with keyboard Cmd + Shift + O in Mac or Ctrl + Shift + O in Windows.
In the example below, DevTools now correctly list all functions in the outline. Previously, DevTools only showed some of the functions.

Chromium issue: 761019, 1191465
Proper error stack traces for Wasm debugging
DevTools now resolves inline function calls and shows proper error stack traces for Wasm debugging.
Previously DevTools only displayed generic Wasm references in the Error stack traces.

The old version of Chrome on the left does not show the source location (e.g. dsquare) in the Error stack traces, whereas the new version on the right does.
Chromium issue: 1189161
Download the preview channels
Consider using the Chrome Canary, Dev, or Beta as your default development browser. These preview channels give you access to the latest DevTools features, let you test cutting-edge web platform APIs, and help you find issues on your site before your users do!
Get in touch with the Chrome DevTools team
Use the following options to discuss the new features, updates, or anything else related to DevTools.
- Submit feedback and feature requests to us at crbug.com.
- Report a DevTools issue using the More options > Help > Report a DevTools issue in DevTools.
- Tweet at @ChromeDevTools.
- Leave comments on What's new in DevTools YouTube videos or DevTools Tips YouTube videos.
What's new in DevTools
A list of everything that has been covered in the What's new in DevTools series.
- DevTools MCP server updates
- Improved trace sharing
- Support for @starting-style
- Editor widget for display: masonry
- Lighthouse 13
- Code suggestions from Gemini
- Enhancements for the DevTools MCP server
- Quicker access to AI assistance
- Debug the full performance trace with Gemini
- Toggle drawer orientation
- Google Developer Program
- Miscellaneous highlights
- Chrome DevTools (MCP) for your AI agent
- Debug the network dependency tree with Gemini
- Export your chats with Gemini
- Persisted track configuration in the Performance panel
- Filter IP protected network requests
- Elements > Layout tab adds masonry layout support
- Lighthouse 12.8.2
- Miscellaneous highlights
- Debug more insights with Gemini
- Emulate the 'Save-Data' header in 'Network conditions'
- See the Baseline status in a CSS property tooltip
- Override form factors in user agent client hints
- Lighthouse 12.8.0
- Miscellaneous highlights
- A more reliable and productive Chrome DevTools
- Upload images in AI assistance for styling
- Add request headers to the table in Network
- Check out the highlights from Google I/O 2025
- Miscellaneous highlights
- Performance panel improvements
- Preconnected origins in 'Network dependency tree' insight
- Server response and redirection times in 'Document request latency' insight
- Redirects in Summary of network requests
- Reduced noise in the performance trace
- Deprecated 'Disable JavaScript samples'
- Geolocation accuracy parameter in Sensors
- Elements panel improvements
- Debug complex CSS values easier
- @function support in Elements > Styles
- Network panel improvements
- has-request-header filter
- Direct Sockets in Isolated Web Apps
- Miscellaneous highlights
- Accessibility
- Google I/O 2025 edition
- Modify and save CSS changes to your workspace with Gemini
- Connect a workspace folder and save changes back to your source files
- Ask Gemini about performance insights
- Annotate performance findings with Gemini
- Add screenshots to your chats with Gemini
- New insights in the Performance panel
- Duplicated JavaScript
- Legacy JavaScript
- Speculations now support rule tags
- Lighthouse 12.6.0
- Miscellaneous highlights
- Accessibility
- Performance panel improvements
- New performance insights
- Click to highlight
- Server timings in Summary of network requests
- Filter cookies in 'Privacy and security'
- Sizes in kB units in tables across panels
- Autocomplete supports corner-shape and corner-*-shape in Elements > Styles
- Experimental: Highlighting issues with elements and attributes in DOM
- Lighthouse 12.5.0
- Miscellaneous highlights
- Performance panel improvements
- Origin and script links for profile and function calls in Performance
- LCP by phase field data support
- Network dependency tree insight
- Duration instead of total and self time in Summary
- Heaviest stack highlighting
- Improved empty states for various panels
- Accessibility tree view in Elements
- Lighthouse 12.4.0
- Miscellaneous highlights
- Privacy and security panel
- Performance panel improvements
- Calibrated CPU throttling presets
- Select different performance events in the same AI chat
- First- and third-party highlighting in Performance
- Field data in marker tooltips and insights
- Forced reflow insight
- 'Optimize DOM size' insight
- Extend the performance trace with console.timeStamp
- Elements panel improvements
- Real-time values of animated styles
- Support for :open pseudo-class and various pseudo-elements
- Copy all console messages
- Byte units in the Memory panel
- Miscellaneous highlights
- Persistent AI chat history
- Performance panel improvements
- Image delivery insight
- Classic and modern keyboard navigation
- Ignore irrelevant scripts in the flame chart
- Timeline marker and range highlighting on hover
- Recommended throttling settings
- Timings markers in an overlay
- Stack traces of JS calls in Summary
- Badge settings moved to menu in Elements
- New 'What's new' panel
- Lighthouse 12.3.0
- Miscellaneous highlights
- Debug network requests, source files, and performance traces with Gemini
- View AI chat history
- Manage extension storage in Application > Storage
- Performance improvements
- Interaction phases in live metrics
- Render blocking information in the Summary tab
- Support for scheduler.postTask events and their initiator arrows
- Animations panel and Elements > Styles tab improvements
- Jump from Elements > Styles to Animations
- Real-time updates in Computed tab
- Compute pressure emulation in Sensors
- JS objects with the same name grouped by source in the Memory panel
- A new look for settings
- Performance insights panel is deprecated and removed from DevTools
- Miscellaneous highlights
- Debug CSS with Gemini
- Control AI features in a dedicated settings tab
- Performance panel improvements
- Annotate and share performance findings
- Get performance insights right in the Performance panel
- Spot excessive layout shifts easier
- Spot the non-composited animations
- Hardware concurrency moves to Sensors
- Ignore anonymous scripts and focus on your code in stack traces
- Elements > Styles: Support for sideways-* writing modes for grid overlays and CSS-wide keywords
- Lighthouse audits for non-HTTP pages in timespan and snapshot modes
- Accessibility improvements
- Miscellaneous highlights
- Network panel improvements
- Network filters reimagined
- HAR exports now exclude sensitive data by default
- Elements panel improvements
- Autocomplete values for text-emphasis-* properties
- Scroll overflows marked with a badge
- Performance panel improvements
- Recommendations in live metrics
- Navigate breadcrumbs
- Memory panel improvements
- New 'Detached elements' profile
- Improved naming of plain JS objects
- Turn off dynamic theming
- Chrome Experiment: Process sharing
- Lighthouse 12.2.1
- Miscellaneous highlights
- Recorder supports export to Puppeteer for Firefox
- Performance panel improvements
- Live metrics observations
- Search requests in the Network track
- See stack traces of performance.mark and performance.measure calls
- Use test address data in the Autofill panel
- Elements panel improvements
- Force more states for specific elements
- Elements > Styles now autocompletes more grid properties
- Lighthouse 12.2.0
- Miscellaneous highlights
- Console insights by Gemini are going live in most European countries
- Performance panel updates
- Enhanced Network track
- Customize performance data with extensibility API
- Details in the Timings track
- Copy all listed requests in the Network panel
- Faster heap snapshots with named HTML tags and less clutter
- Open Animations panel to capture animations and edit @keyframes live
- Lighthouse 12.1.0
- Accessibility improvements
- Miscellaneous highlights
- Inspect CSS anchor positioning in the Elements panel
- Sources panel improvements