Reduce unnecessary fetches in scalar chart #163
Merged
Conversation
This file contains hidden or bidirectional Unicode text that may be interpreted or compiled differently than what appears below. To review, open the file in an editor that reveals hidden Unicode characters.
Learn more about bidirectional Unicode characters
teamdandelion
approved these changes
Jun 27, 2017
38994ba to
1152401
Compare
Summary: Remember which runs we've fetched since the last explicit reload. If we need to load more data, don't fetch those runs again. More details on docstring on new property. Test Plan: Open the network panel. Open a category with a dozen or so tags. Then, in the list of runs, go down the list and check each run one at a time (starting from all disabled). Before this change: 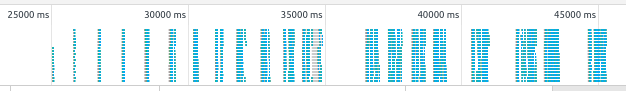 You can see that the number of network requests is linear in the number of selected runs, so the total number of requests is quadratic in the number of selections you make. After this change: 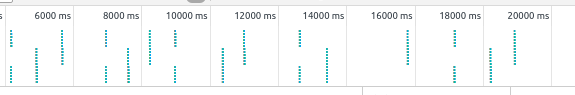 You can see that the number of network requests is constant in the number of selected runs, so the total number of requests is linear in the number of selections you make. Also, deselecting runs now causes zero requests instead of $n$, where $n$ is the number of runs that remain selected. Clicking "reload" or waiting 30 seconds does issue a big blob of requests, as desired. wchargin-branch: scalars-remember-fetches
367e5c9 to
e2ba90d
Compare
chihuahua
added a commit
that referenced
this pull request
Aug 18, 2017
Specifically, rewired the vz_line_chart component to take

- an object that configures the X axis (the specific field and scale)
- an Plottable accessor that computes the value on the Y axis
- a list of TooltipColumns that specify the columns within the table in the tooltip

Rewired scalar line charts to use the generalized logic. This change sets the stage for the PR curve plugin to also use vz_line_chart, discouraging duplicate code.

Unfortunately, by generalizing vz_line_chart instead of tf-scalar-chart.html, we do miss out on some benefits. tf-scalar-chart.html contains some logic to correct bugs in Plottable (#163, #189, #204). We should think about how to bring those benefits to other dashboards that use vz_line_chart.
chihuahua
added a commit
that referenced
this pull request
Aug 22, 2017
Specifically, rewired the vz_line_chart component to take

- an object that configures the X axis (the specific field and scale)
- an Plottable accessor that computes the value on the Y axis
- a list of TooltipColumns that specify the columns within the table in the tooltip

Rewired scalar line charts to use the generalized logic. This change sets the stage for the PR curve plugin to also use vz_line_chart, discouraging duplicate code.

Unfortunately, by generalizing vz_line_chart instead of tf-scalar-chart.html, we do miss out on some benefits. tf-scalar-chart.html contains some logic to correct bugs in Plottable (#163, #189, #204). We should think about how to bring those benefits to other dashboards that use vz_line_chart.
chihuahua
added a commit
that referenced
this pull request
Aug 25, 2017
Specifically, rewired the vz_line_chart component to take

- an object that configures the X axis (the specific field and scale)
- an Plottable accessor that computes the value on the Y axis
- a list of TooltipColumns that specify the columns within the table in the tooltip

Rewired scalar line charts to use the generalized logic. This change sets the stage for the PR curve plugin to also use vz_line_chart, discouraging duplicate code.

Unfortunately, by generalizing vz_line_chart instead of tf-scalar-chart.html, we do miss out on some benefits. tf-scalar-chart.html contains some logic to correct bugs in Plottable (#163, #189, #204). We should think about how to bring those benefits to other dashboards that use vz_line_chart.
chihuahua
added a commit
that referenced
this pull request
Sep 4, 2017
Before this change, tf-scalar-chart.html contains much logic specific to
the scalars plugin. We extract that scalars-specific logic into a new
component called tf-scalar-card. Some of the logic extracted includes
properties that allow for setting X and Y axes, the buttons under the
chart, and the callback that is run when data is received from the
server.

This change is a step towards allowing any plugin to make use of the
tf-scalar-chart component (albeit a subsequent change will move and
rename this component to clarify that it is generally applicable). That
goal is desirable because tf-scalar-chart contains a lot of logic that
corrects for bugs in the vz-line-chart component and Plottable. That
logic includes #163, #189, and #204.
chihuahua
added a commit
that referenced
this pull request
Sep 12, 2017
Before this change, tf-scalar-chart.html contains much logic specific to
the scalars plugin. We extract that scalars-specific logic into a new
component called tf-scalar-card. Some of the logic extracted includes
properties that allow for setting X and Y axes, the buttons under the
chart, and the callback that is run when data is received from the
server.

This change is a step towards allowing any plugin to make use of the
tf-scalar-chart component (albeit a subsequent change will move and
rename this component to clarify that it is generally applicable). That
goal is desirable because tf-scalar-chart contains a lot of logic that
corrects for bugs in the vz-line-chart component and Plottable. That
logic includes #163, #189, and #204.
chihuahua
added a commit
that referenced
this pull request
Sep 15, 2017
Before this change, tf-scalar-chart.html contains much logic specific to
the scalars plugin. We extract that scalars-specific logic into a new
component called tf-scalar-card. Some of the logic extracted includes
properties that allow for setting X and Y axes, the buttons under the
chart, and the callback that is run when data is received from the
server.

This change is a step towards allowing any plugin to make use of the
tf-scalar-chart component (albeit a subsequent change will move and
rename this component to clarify that it is generally applicable). That
goal is desirable because tf-scalar-chart contains a lot of fixes that
correct for bugs in the vz-line-chart component and Plottable. Those fixes
include #163, #189, and #204.
chihuahua
added a commit
that referenced
this pull request
Sep 27, 2017
Refactored the card that loads PR curves to use the
tf-line-chart-loader component. This has several major advantages,
as detailed by #163, #189, and #204.

Part of this effort involved adding defaultXRange and
defaultYRange fields to tf-line-chart-data-loader.

Test plan:
Run the scalars and PR curves demos. Merge the directories, and
start TensorBoard. Note that the scalars and PR curves dashboards
still WAI. Check that sliders and buttons work.
Sign up for free
to join this conversation on GitHub.
Already have an account?
Sign in to comment
2 participants
Add this suggestion to a batch that can be applied as a single commit.
This suggestion is invalid because no changes were made to the code.
Suggestions cannot be applied while the pull request is closed.
Suggestions cannot be applied while viewing a subset of changes.
Only one suggestion per line can be applied in a batch.
Add this suggestion to a batch that can be applied as a single commit.
Applying suggestions on deleted lines is not supported.
You must change the existing code in this line in order to create a valid suggestion.
Outdated suggestions cannot be applied.
This suggestion has been applied or marked resolved.
Suggestions cannot be applied from pending reviews.
Suggestions cannot be applied on multi-line comments.
Suggestions cannot be applied while the pull request is queued to merge.
Suggestion cannot be applied right now. Please check back later.
Summary:
Remember which runs we've fetched since the last explicit reload. If we
need to load more data, don't fetch those runs again.
More details on docstring on new property.
Test Plan:
Open the network panel. Open a category with a dozen or so tags. Then,
in the list of runs, go down the list and check each run one at a time
(starting from all disabled).
Before this change:

You can see that the number of network requests is linear in the number
of selected runs, so the total number of requests is quadratic in the
number of selections you make.
After this change:

You can see that the number of network requests is constant in the number
of selected runs, so the total number of requests is linear in the
number of selections you make.
Also, deselecting runs now causes zero requests instead of$n$ ,$n$ is the number of runs that remain selected.
where
Clicking "reload" or waiting 30 seconds does issue a big blob of
requests, as desired.
wchargin-branch: scalars-remember-fetches