
Step-by-step replay in the Recorder
You can now set a breakpoint and replay a user flow step by step in the Recorder panel.
To set a breakpoint, click on the blue dot next to a step. Replay your user flow, the replay will pause before executing the step. From here, you can continue the replay, execute a step, or cancel the replay.
With this feature, you can fully visualize and debug your user flow with ease.
See Recorder features reference for more information.

Chromium issue: 1257499
Support mouse over event in the Recorder panel
The Recorder now supports adding a mouse over (hover) step manually in a recording.
This demo shows a pop up menu on hover. Try to record a user flow and click a menu item.
If you replay the user flow now, it will fail because the Recorder doesn’t capture mouse over events automatically during recording. To resolve this, add a step manually to hover over the selector before clicking the menu item.

Chromium issue: 1257499
Largest Contentful Paint (LCP) in the Performance insights panel
LCP is an important, user-centric metric for measuring perceived load speed. You can now find out the critical paths and root causes of a Largest Contentful Paint (LCP).
In a performance recording, click on the LCP badge in the Timeline. In the Details pane, you can view the LCP score, learn how to fix resources that slow down the LCP and see the critical path for the LCP resource.
See Performance Insights to learn how to get actionable insights and improve your website’s performance with the panel.

Chromium issue: 1326481
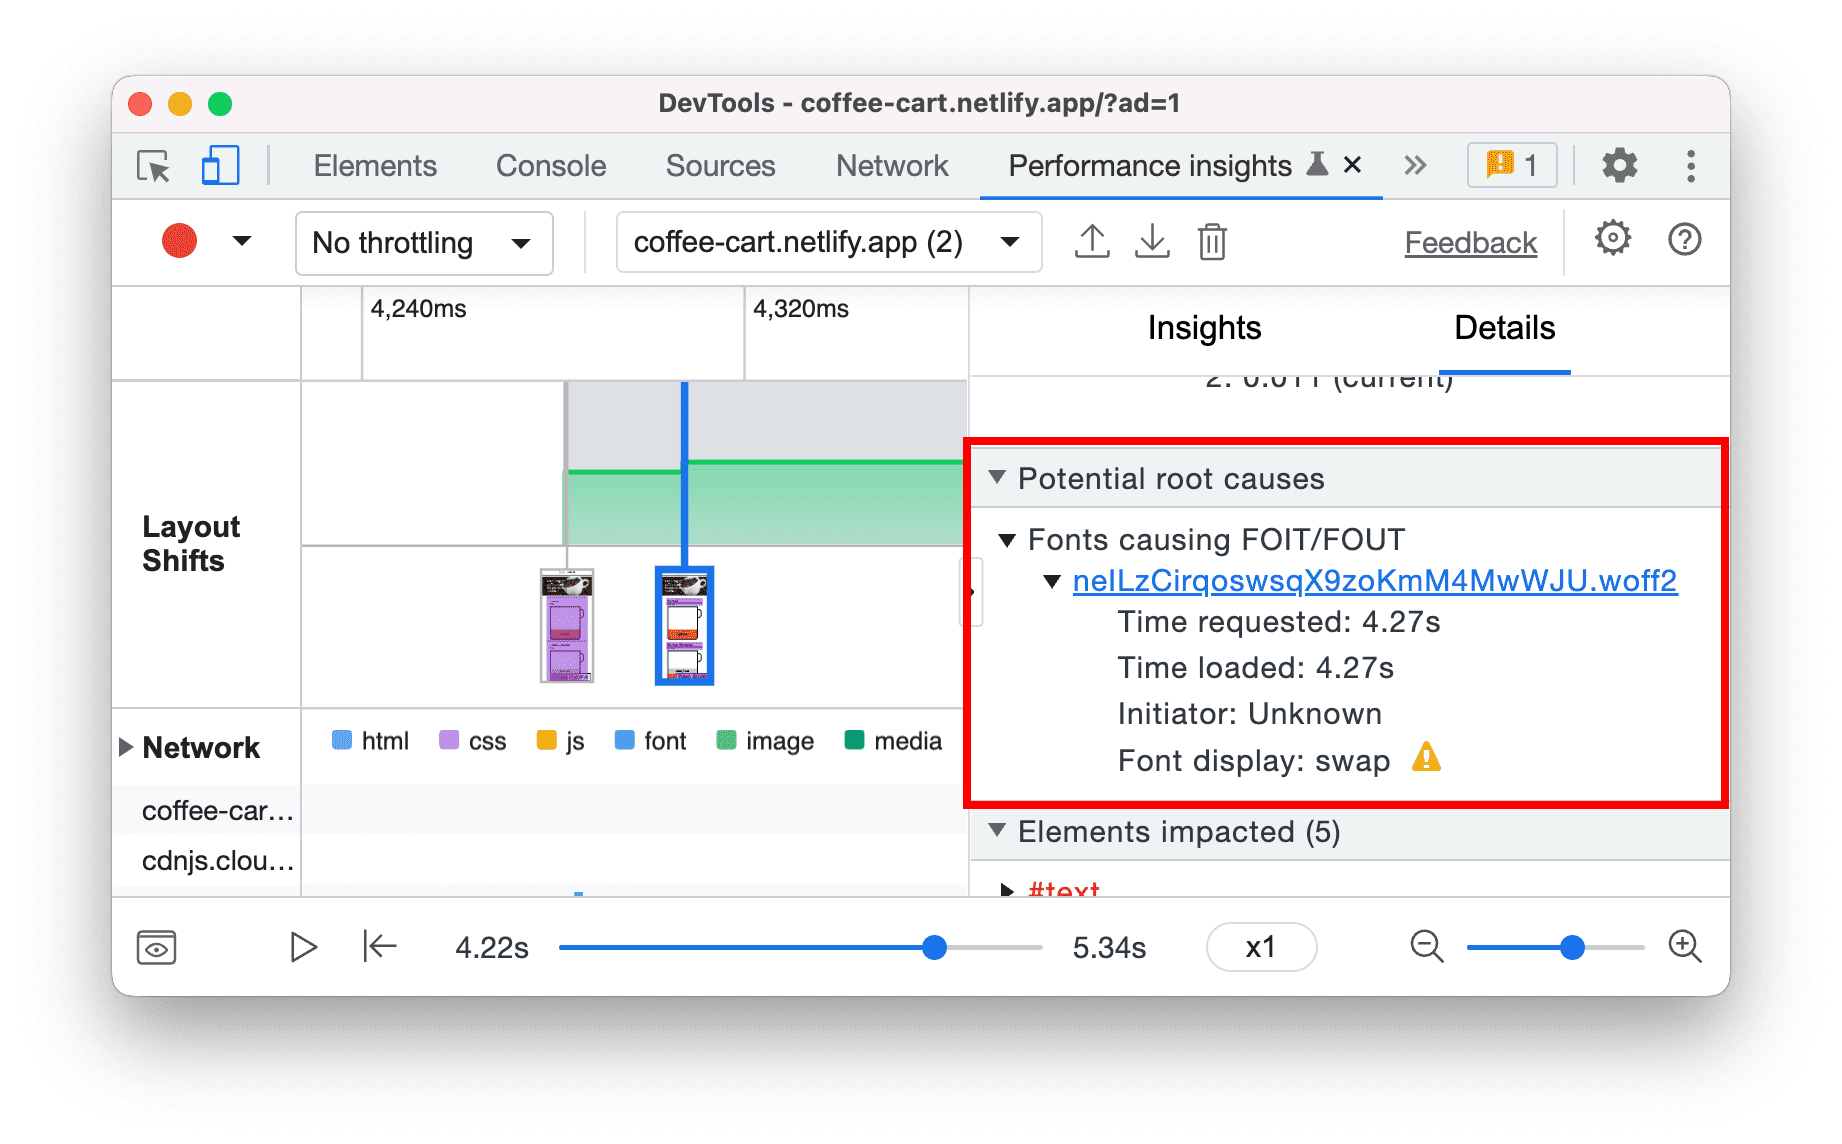
Identify flashes of text (FOIT, FOUT) as potential root causes for layout shifts
The Performance insights panel now detects flash of invisible text (FOIT) and flash of unstyled text (FOUT) as potential root causes for layout shifts.
To view the potential root causes of a layout shift, click on a screenshot in the Layout shifts track.
See Optimize WebFont loading and rendering to learn the technique to prevent layout shifts.
Chromium issues: 1334628, 1328873
Protocol handlers in the Manifest pane
You can now use DevTools to test the URL protocol handler registration for Progressive Web Apps (PWA).
The URL protocol handler registration lets installed PWAs handle links that use a specific protocol (e.g. magnet, web+example) for a more integrated experience.
Navigate to the Protocol Handlers section via the Application > Manifest pane. You can view and test all the available protocols here.
For example, install this demo PWA. In the Protocol Handlers section, type “americano” and click Test protocol to open the coffee page in the PWA.

Chromium issues: 1300613
Top layer badge in the Elements panel
Use the top layer badge to understand the concept of the top layer and visualize how the top layer content changes.
The <dialog> element has recently become stable across browsers. When you open a dialog, it is put into a top layer. Top level content renders on top of all the other content.
In this demo, click Open dialog.
To help visualize the top layer elements, DevTools adds a top layer container (#top-layer) to the DOM tree. It resides after the closing </html> tag.
To jump from the top layer container element to the top layer tree element, click the reveal button next to the element or its backdrop in the top layer container.
Next to the top layer tree element (for example, the dialog element), click the top-layer badge to jump to the top layer container.
Chromium issue: 1313690
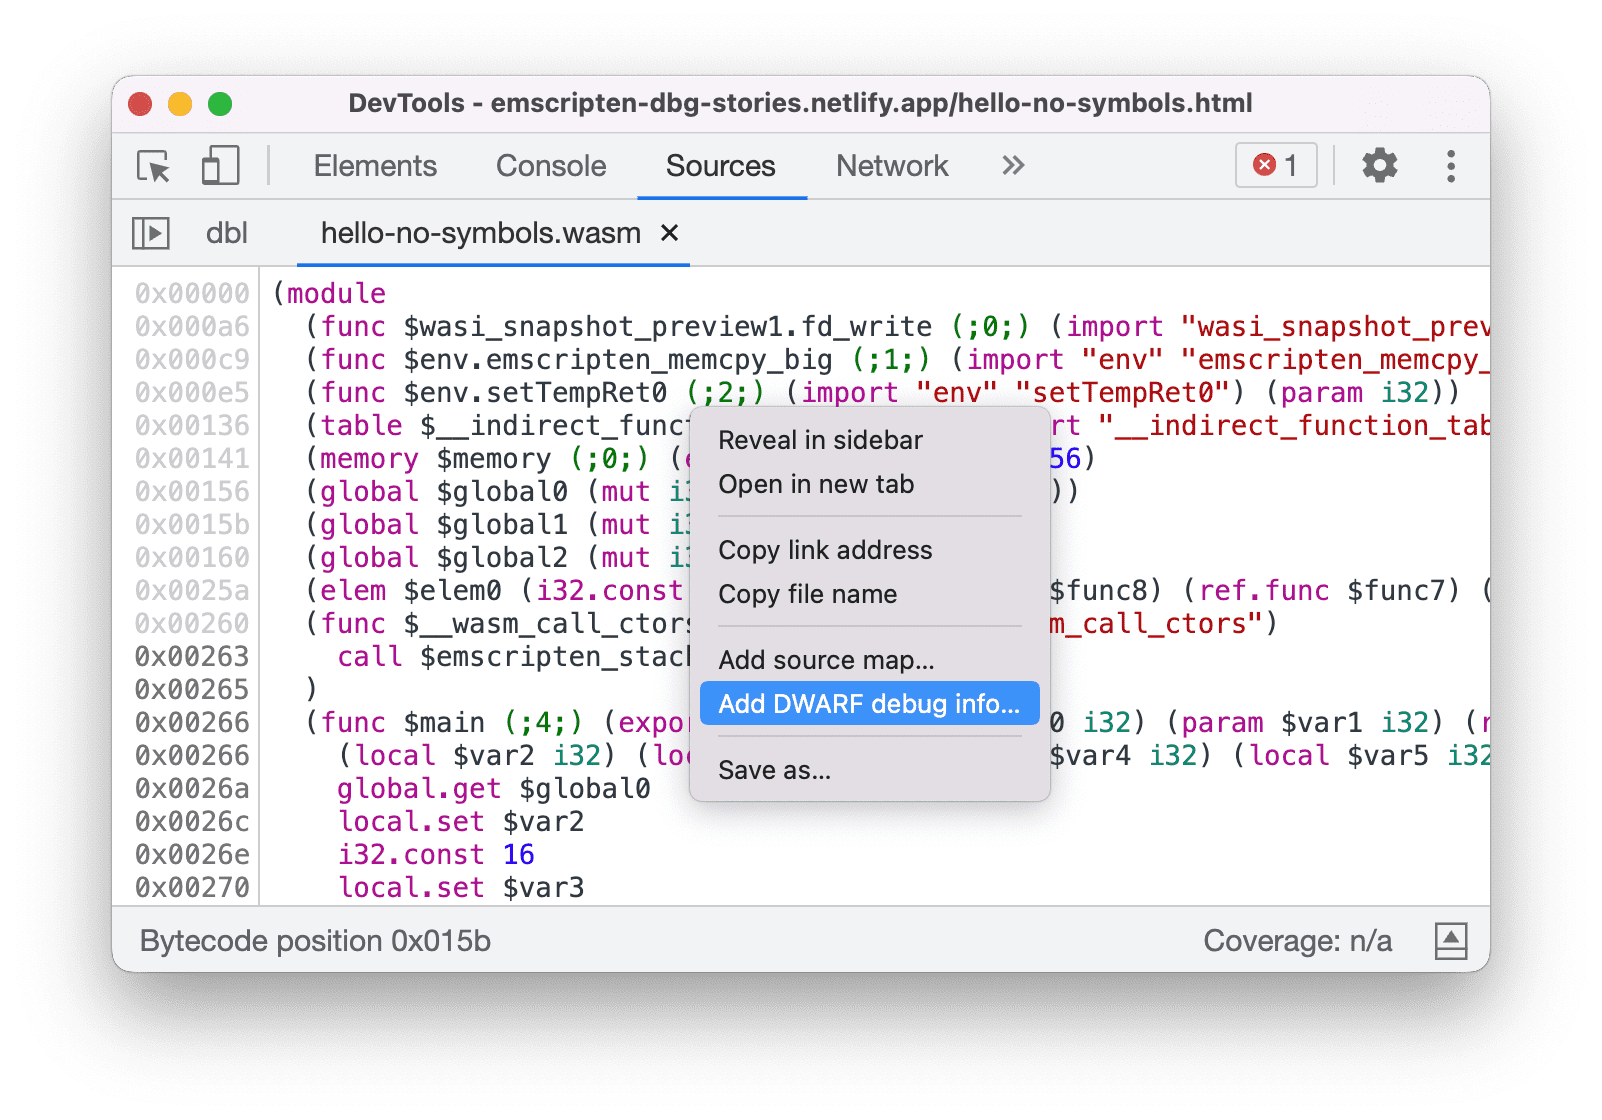
Attach Wasm debugging information at runtime
You can now attach DWARF debugging information for wasm during runtime. Previously, the Sources panel only supported attaching source maps to JavaScript and Wasm files.
Open a Wasm file in the Sources panel. Right-click in the editor and select Add DWARF debugging info… to attach debugging information on demand.
Chromium issue: 1341255
Support live edit during debugging
You can now edit the top-most function on the stack without restarting the debugger.
In Chrome 104, DevTools brings back the restart frame feature. However, you weren't able to edit the function you are currently paused in. It is common for developers to break in a function and then edit that function while paused.
With this update, the debugger automatically restarts the function with the following restrictions:
- Only the top-most function can be edited while paused
- No recursive call on the same function further down the stack

Chromium issue: 1334484
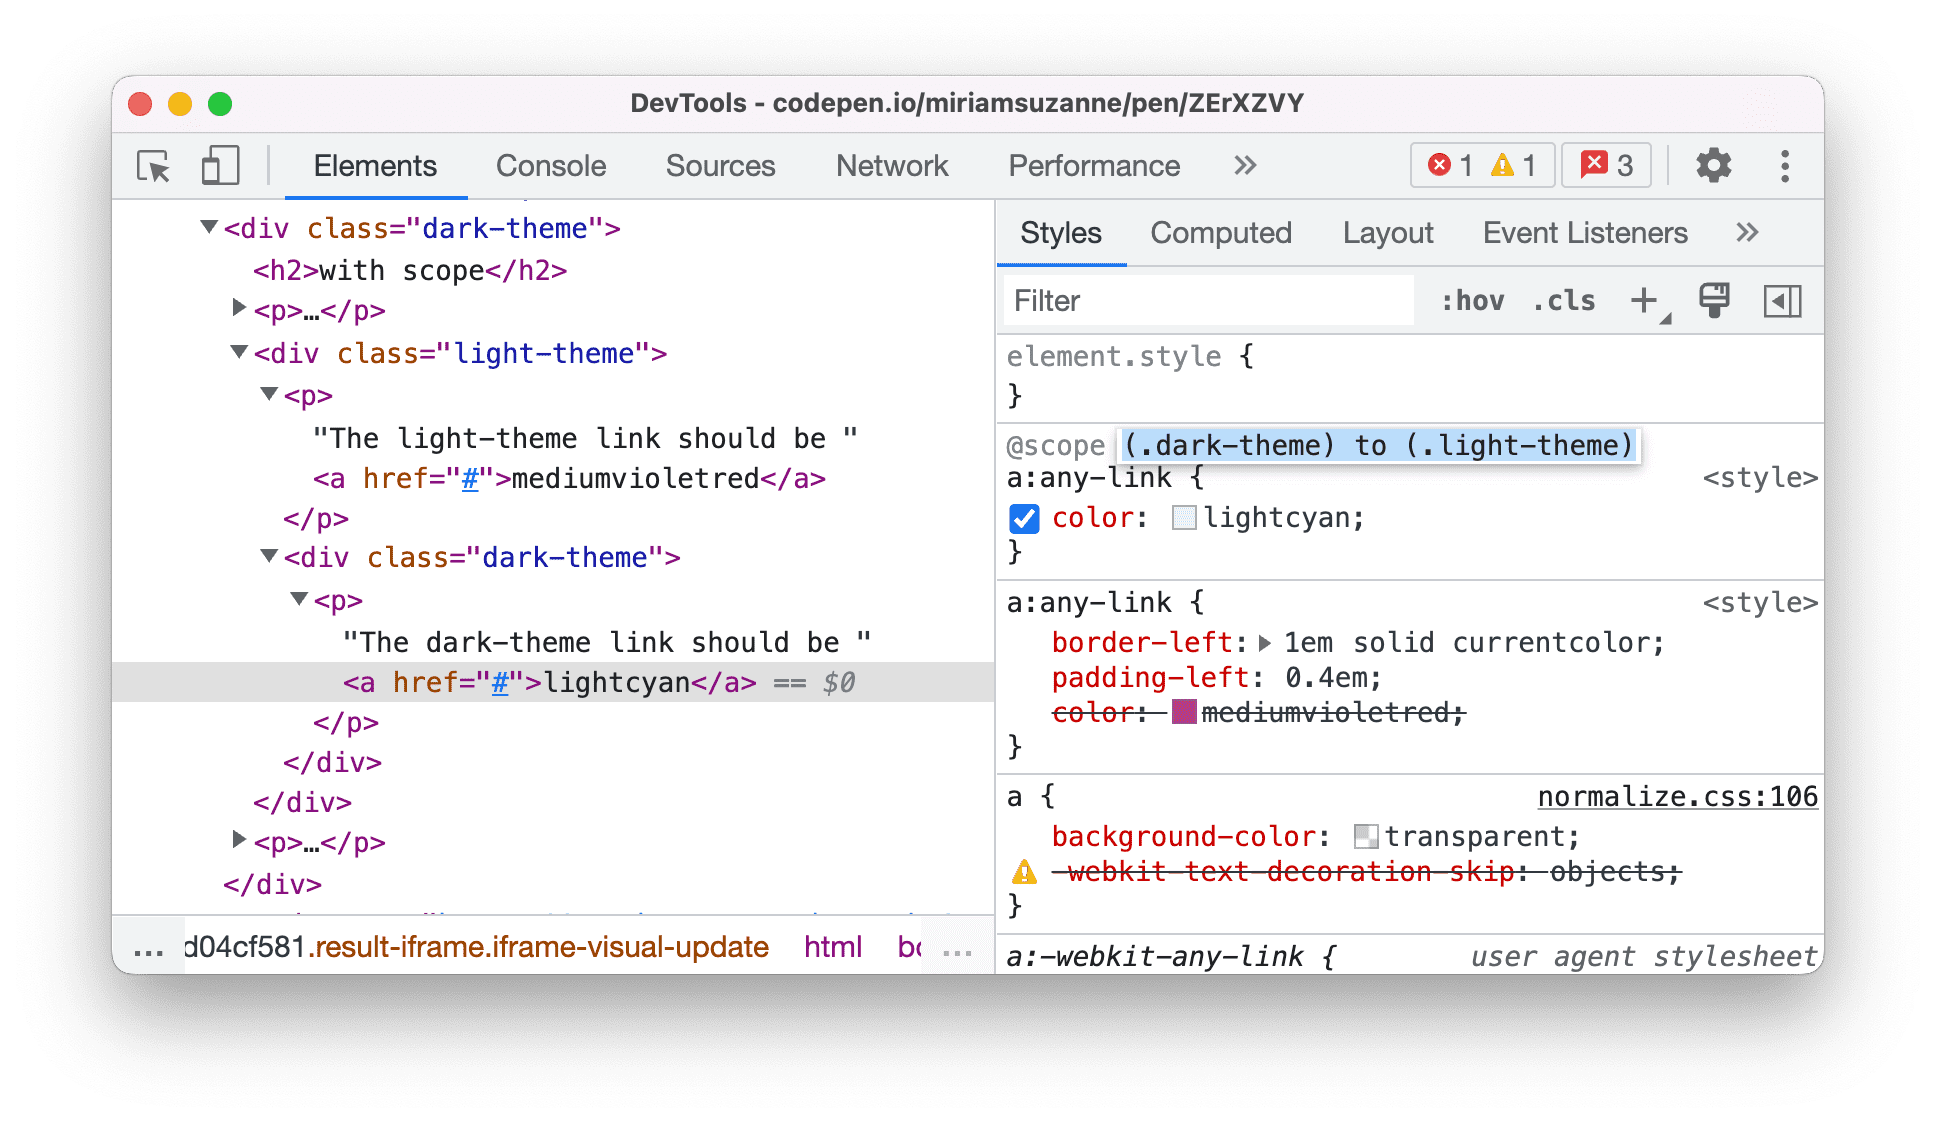
View and edit @scope at rules in the Styles pane
You can now view and edit the CSS @scope at-rules in the Styles pane.
The @scope at rules is part of the CSS Cascading and Inheritance Level 6 specification. These rules allow developers to scope style rules in CSS.
Open this demo page and inspect the hyperlink within the <div class=”dark-theme”> element. In the Styles pane, view the @scope at-rules. Click the rule declaration to edit it.
Chromium issue: 1337777
Source map improvements
Here are a few fixes on source maps to improve the overall debugging experience:
- DevTools now properly resolves source map identifiers with punctuation. Some modern minifiers (for example, esbuild) produce source maps that merge identifiers with subsequent punctuation (comma, parentheses, semicolon).
- DevTools now resolves source map names for constructors with a
supercall. - Fixed source map URL indexing for duplicate canonical URLs. Previously, breakpoints were not activated in some files because of duplicate canonical URLs.

Chromium issue: 1335338, 1333411
Miscellaneous highlights
These are some noteworthy fixes in this release:
- Properly remove a local storage key value pair from the table in the Application > Local Storage pane when it is deleted. (1339280)
- The color previews are now correctly displayed when viewing CSS files in the Sources panel. Previously, their positions were misplaced. (1340062)
- Consistently display the CSS flex and grid items in the Layout pane, as well as display them as badges in the Elements panel. Previously, the flex and grid items were randomly missing in both places. (1340441, 1273992)
- A new Creator Ad Script link is available for ad frames if DevTools found the script that caused the frame to be labeled as an ad. You can open a frame via Application > Frames. (1217041)
Download the preview channels
Consider using the Chrome Canary, Dev, or Beta as your default development browser. These preview channels give you access to the latest DevTools features, let you test cutting-edge web platform APIs, and help you find issues on your site before your users do!
Get in touch with the Chrome DevTools team
Use the following options to discuss the new features, updates, or anything else related to DevTools.
- Submit feedback and feature requests to us at crbug.com.
- Report a DevTools issue using the More options > Help > Report a DevTools issue in DevTools.
- Tweet at @ChromeDevTools.
- Leave comments on What's new in DevTools YouTube videos or DevTools Tips YouTube videos.
What's new in DevTools
A list of everything that has been covered in the What's new in DevTools series.
- DevTools MCP server updates
- Improved trace sharing
- Support for @starting-style
- Editor widget for display: masonry
- Lighthouse 13
- Code suggestions from Gemini
- Enhancements for the DevTools MCP server
- Quicker access to AI assistance
- Debug the full performance trace with Gemini
- Toggle drawer orientation
- Google Developer Program
- Miscellaneous highlights
- Chrome DevTools (MCP) for your AI agent
- Debug the network dependency tree with Gemini
- Export your chats with Gemini
- Persisted track configuration in the Performance panel
- Filter IP protected network requests
- Elements > Layout tab adds masonry layout support
- Lighthouse 12.8.2
- Miscellaneous highlights
- Debug more insights with Gemini
- Emulate the 'Save-Data' header in 'Network conditions'
- See the Baseline status in a CSS property tooltip
- Override form factors in user agent client hints
- Lighthouse 12.8.0
- Miscellaneous highlights
- A more reliable and productive Chrome DevTools
- Upload images in AI assistance for styling
- Add request headers to the table in Network
- Check out the highlights from Google I/O 2025
- Miscellaneous highlights
- Performance panel improvements
- Preconnected origins in 'Network dependency tree' insight
- Server response and redirection times in 'Document request latency' insight
- Redirects in Summary of network requests
- Reduced noise in the performance trace
- Deprecated 'Disable JavaScript samples'
- Geolocation accuracy parameter in Sensors
- Elements panel improvements
- Debug complex CSS values easier
- @function support in Elements > Styles
- Network panel improvements
- has-request-header filter
- Direct Sockets in Isolated Web Apps
- Miscellaneous highlights
- Accessibility
- Google I/O 2025 edition
- Modify and save CSS changes to your workspace with Gemini
- Connect a workspace folder and save changes back to your source files
- Ask Gemini about performance insights
- Annotate performance findings with Gemini
- Add screenshots to your chats with Gemini
- New insights in the Performance panel
- Duplicated JavaScript
- Legacy JavaScript
- Speculations now support rule tags
- Lighthouse 12.6.0
- Miscellaneous highlights
- Accessibility
- Performance panel improvements
- New performance insights
- Click to highlight
- Server timings in Summary of network requests
- Filter cookies in 'Privacy and security'
- Sizes in kB units in tables across panels
- Autocomplete supports corner-shape and corner-*-shape in Elements > Styles
- Experimental: Highlighting issues with elements and attributes in DOM
- Lighthouse 12.5.0
- Miscellaneous highlights
- Performance panel improvements
- Origin and script links for profile and function calls in Performance
- LCP by phase field data support
- Network dependency tree insight
- Duration instead of total and self time in Summary
- Heaviest stack highlighting
- Improved empty states for various panels
- Accessibility tree view in Elements
- Lighthouse 12.4.0
- Miscellaneous highlights
- Privacy and security panel
- Performance panel improvements
- Calibrated CPU throttling presets
- Select different performance events in the same AI chat
- First- and third-party highlighting in Performance
- Field data in marker tooltips and insights
- Forced reflow insight
- 'Optimize DOM size' insight
- Extend the performance trace with console.timeStamp
- Elements panel improvements
- Real-time values of animated styles
- Support for :open pseudo-class and various pseudo-elements
- Copy all console messages
- Byte units in the Memory panel
- Miscellaneous highlights
- Persistent AI chat history
- Performance panel improvements
- Image delivery insight
- Classic and modern keyboard navigation
- Ignore irrelevant scripts in the flame chart
- Timeline marker and range highlighting on hover
- Recommended throttling settings
- Timings markers in an overlay
- Stack traces of JS calls in Summary
- Badge settings moved to menu in Elements
- New 'What's new' panel
- Lighthouse 12.3.0