
This is a maintained fork of the excellent PyCallGraph project. The latest version is 1.0.1, and was released on 2013-09-17. The next release starts from 2.0.0 due to deprecating Python 2.
Installation is easy as:
pip install callgraph4py
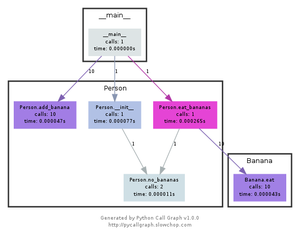
Welcome! Python Call Graph is a Python module that creates call graph visualizations for Python applications.
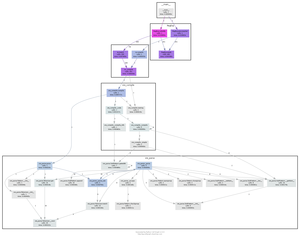
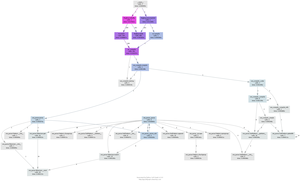
Click on the images below to see a larger version and the source code that generated them.
- Support for Python 3.7+.
- Static visualizations of the call graph using Graphviz.
- Execute pycallgraph from the command line or import it in your code.
- Customisable colors. You can programatically set the colors based on number of calls, time taken, memory usage, etc.
- Modules can be visually grouped together.
- Easily extendable to create your own output formats.
The following commands shall collect the call graph into the specified output file in .dot format, which can then be visualized as an SVG image:
pycallgraph graphviz --output-format=dot --output-file=script.dot -- ./script.py
dot -Tsvg script.dot > script.svg
Clone this repository and issue a poetry install command, in order to install the current version of package.