
Discover new debugging workflows with this comprehensive reference of Chrome DevTools debugging features.
See Get Started With Debugging JavaScript In Chrome DevTools to learn the basics of debugging.
Pause code with breakpoints
Set a breakpoint so that you can pause your code in the middle of its execution. To learn how to set breakpoints, see Pause Your Code With Breakpoints.
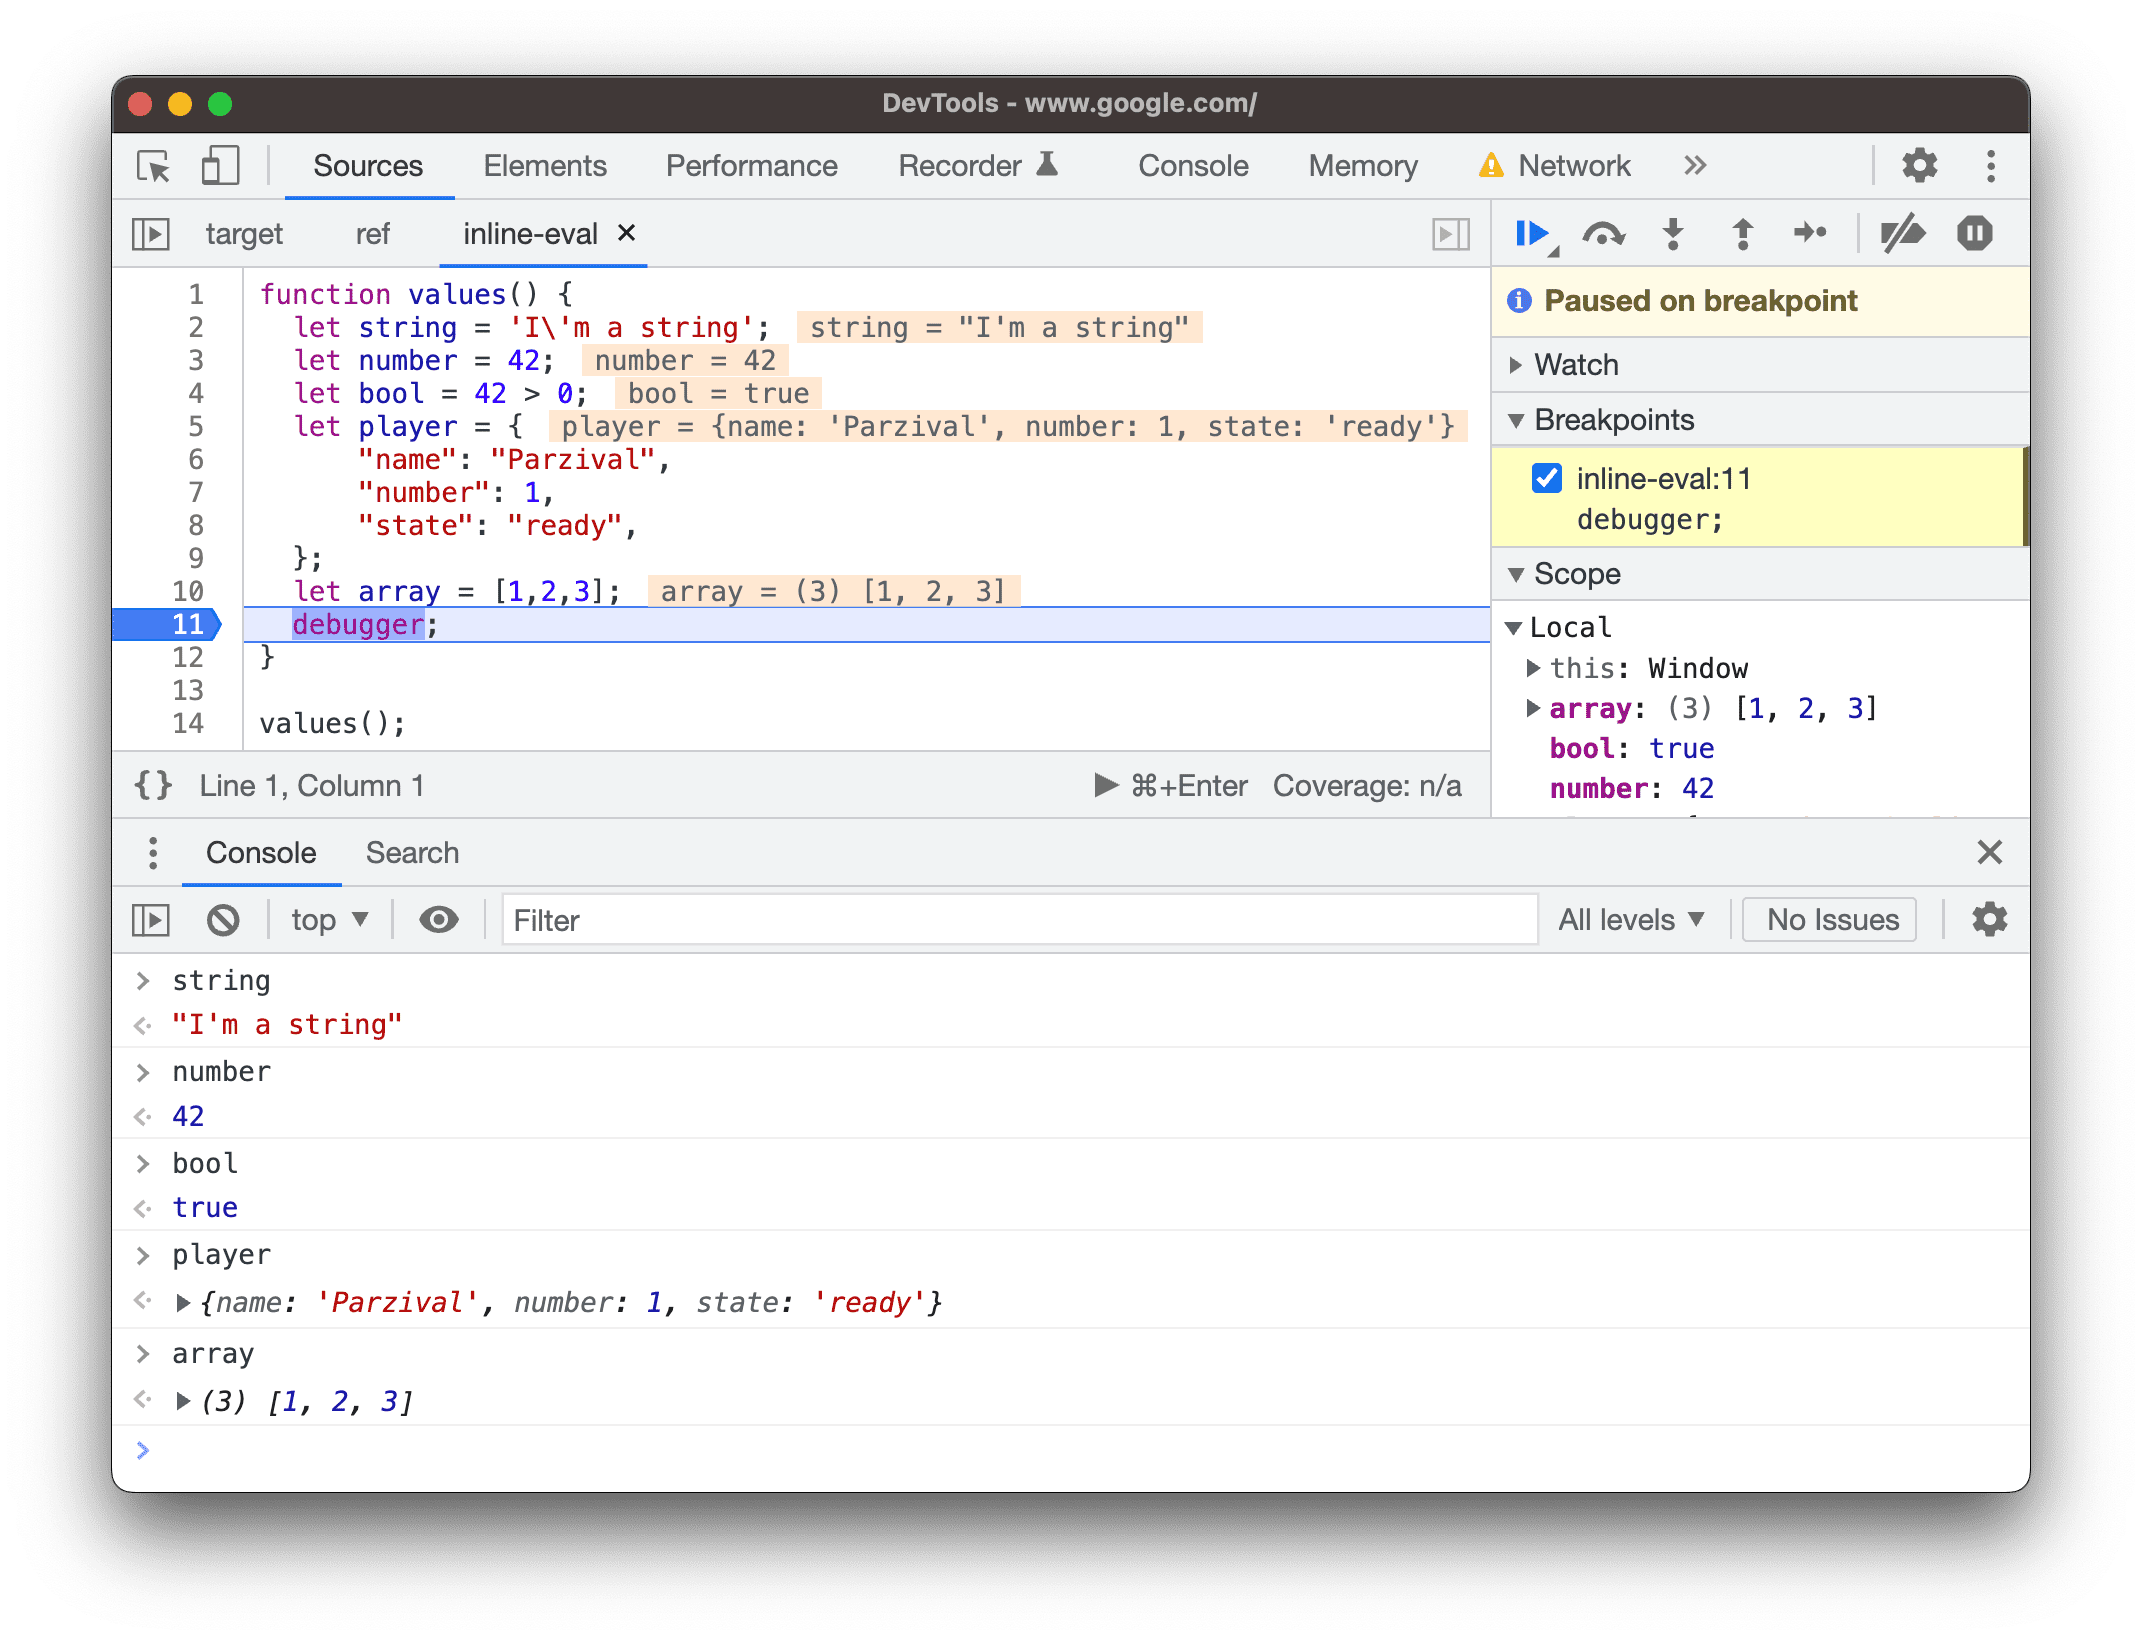
Check values when paused
While the execution is paused, the debugger evaluates all variables, constants, and objects within the current function up to a breakpoint. The debugger shows the current values inline next to the corresponding declarations.
You can use the Console to query the evaluated variables, constants, and objects.
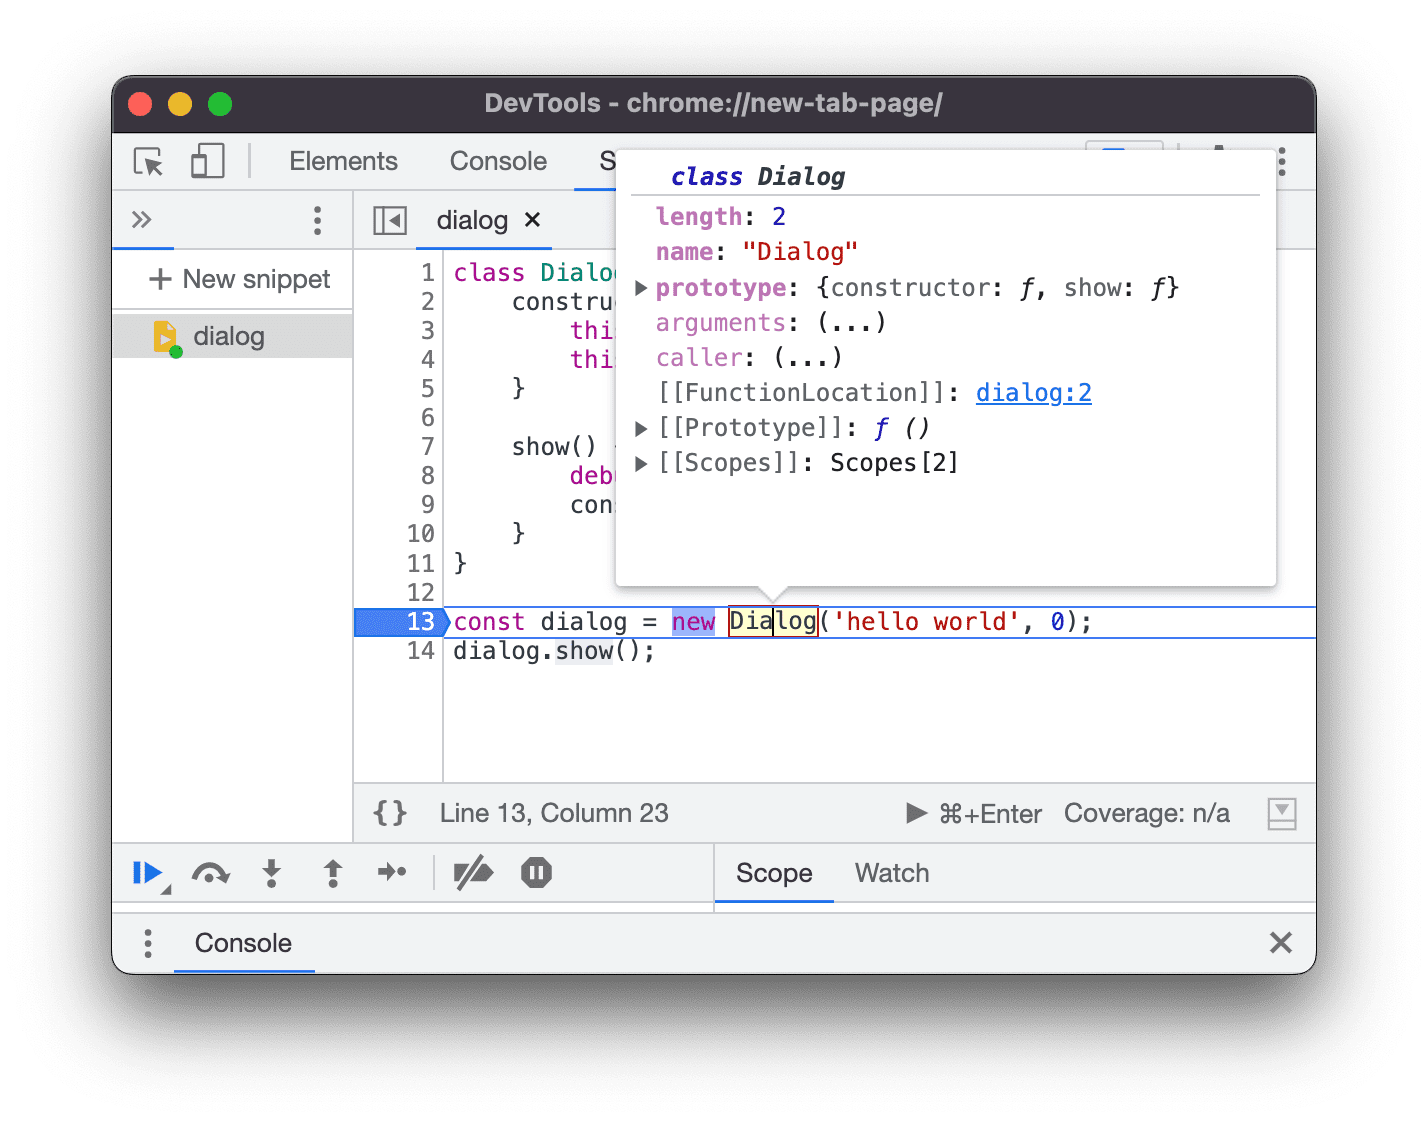
Preview class and function properties on hover
While the execution is paused, hover over a class or function name to preview its properties.
Step through code
Once your code is paused, step through it, one expression at a time, investigating control flow and property values along the way.
Step over line of code
When paused on a line of code containing a function that's not relevant to the problem you're debugging, click Step over step_over to execute the function without stepping into it.
For example, suppose you're debugging the following code:
function updateHeader() {
  var day = new Date().getDay();
  var name = getName(); // A
  updateName(name); // D
}
function getName() {
  var name = app.first + ' ' + app.last; // B
  return name; // C
}
You're paused on A. Once you've pressed
step_over, DevTools executes all
the code in the function that you're stepping over, which is B and C.
DevTools then pauses on D.
Step into line of code
When paused on a function call that is related to the problem you're debugging,
click Step into
to
investigate that function.
For example, suppose you're debugging the following code:
function updateHeader() {
  var day = new Date().getDay();
  var name = getName(); // A
  updateName(name);
}
function getName() {
  var name = app.first + ' ' + app.last; // B
  return name;
}
You're paused on A. By pressing Step into, DevTools executes this line of
code, then pauses on B.
Step out of line of code
When paused inside of a function that is not related to the problem you're debugging, click step_out to execute the rest of the function's code.
For example, suppose you're debugging the following code:
function updateHeader() {
  var day = new Date().getDay();
  var name = getName();
  updateName(name); // C
}
function getName() {
  var name = app.first + ' ' + app.last; // A
  return name; // B
}
You're paused on A. By clicking step_out,
DevTools executes the rest of the code in getName(), which is just B in
this example, and then pauses on C.
Run all code up to a certain line
When debugging a long function, there may be a lot of code that is not related to the problem you're debugging.
You could step through all the lines, but that can be tedious. You could set a line-of-code breakpoint on the line you're interested in and then press resume, but there's a faster way.
Right-click the line of code that you're interested in, and select Continue to here. DevTools runs all of the code up to that point, and then pauses on that line.
Resume script execution
To continue your script's execution after a pause, click resume. DevTools executes the script up until the next breakpoint, if any.