This interactive tutorial shows you how to log and filter messages in the Chrome DevTools Console.
This tutorial is intended to be completed in order. It assumes that you understand the fundamentals of web development, such as how to use JavaScript to add interactivity to a page.
Set up the demo and DevTools
This tutorial is designed so that you can open up the demo and try all the workflows yourself. When you physically follow along, you're more likely to remember the workflows later.
- Open the demo.
Optional: Move the demo to a separate window. In this example, the tutorial is on the left, and the demo is on the right.
Focus the demo and then press Control+Shift+J or Command+Option+J (Mac) to open DevTools. By default DevTools opens to the right of the demo.
Optional: Dock DevTools to the bottom of the window or undock it into a separate window.
DevTools docked to the bottom of the demo:
DevTools undocked in a separate window:


View messages logged from JavaScript
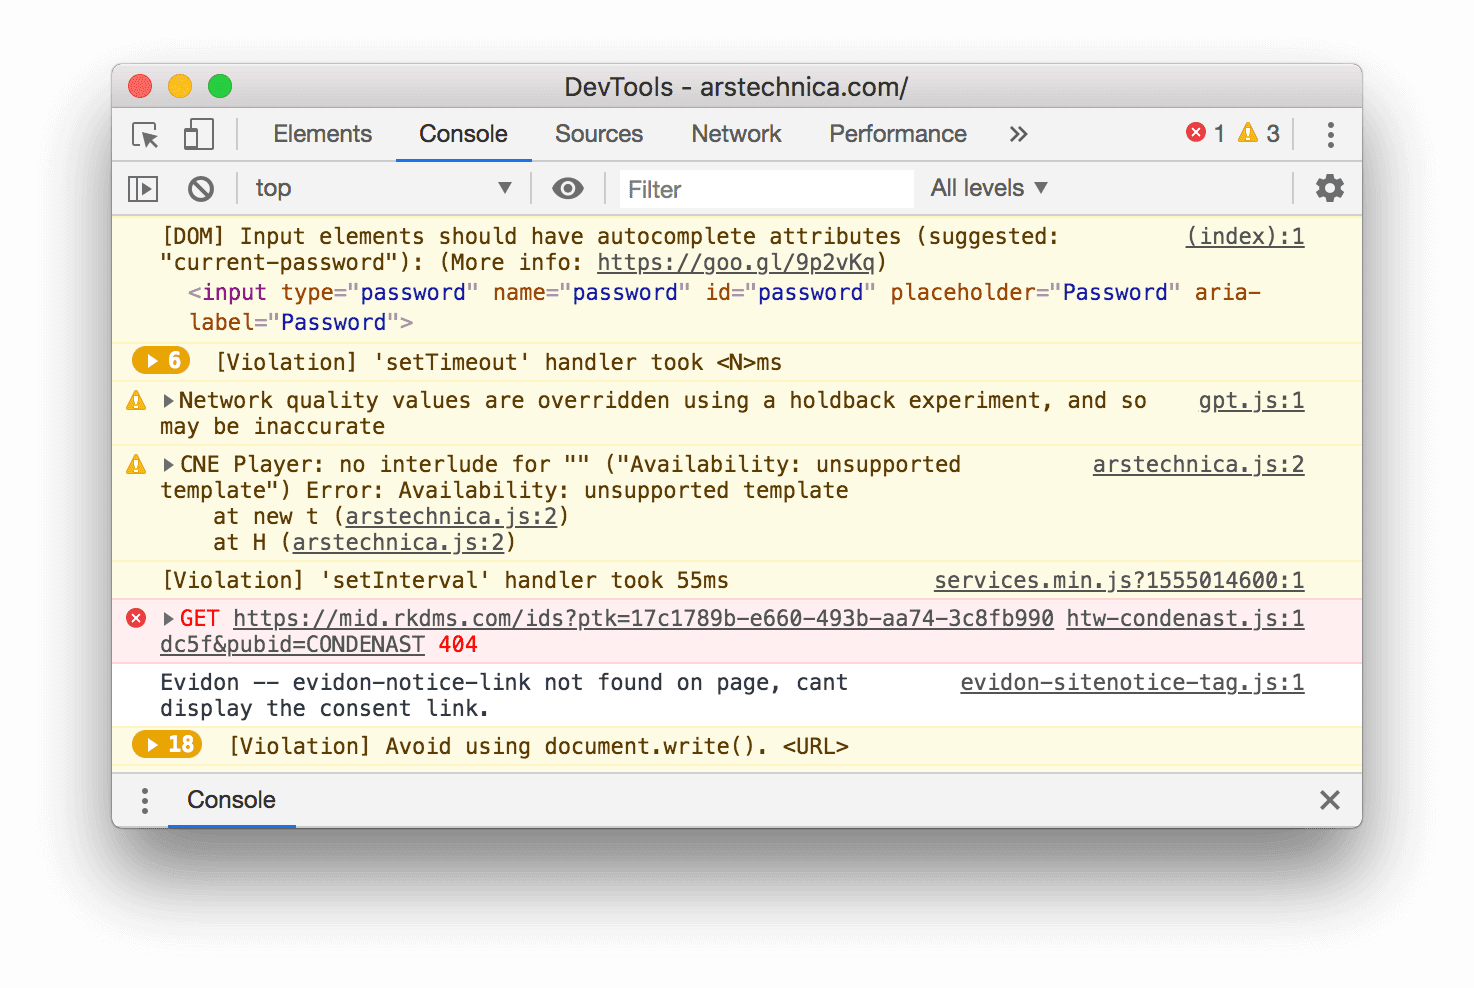
Most messages that you see in the Console come from the web developers who wrote the page's JavaScript. The goal of this section is to introduce you to the different message types that you're likely to see in the Console, and explain how you can log each message type yourself from your own JavaScript.
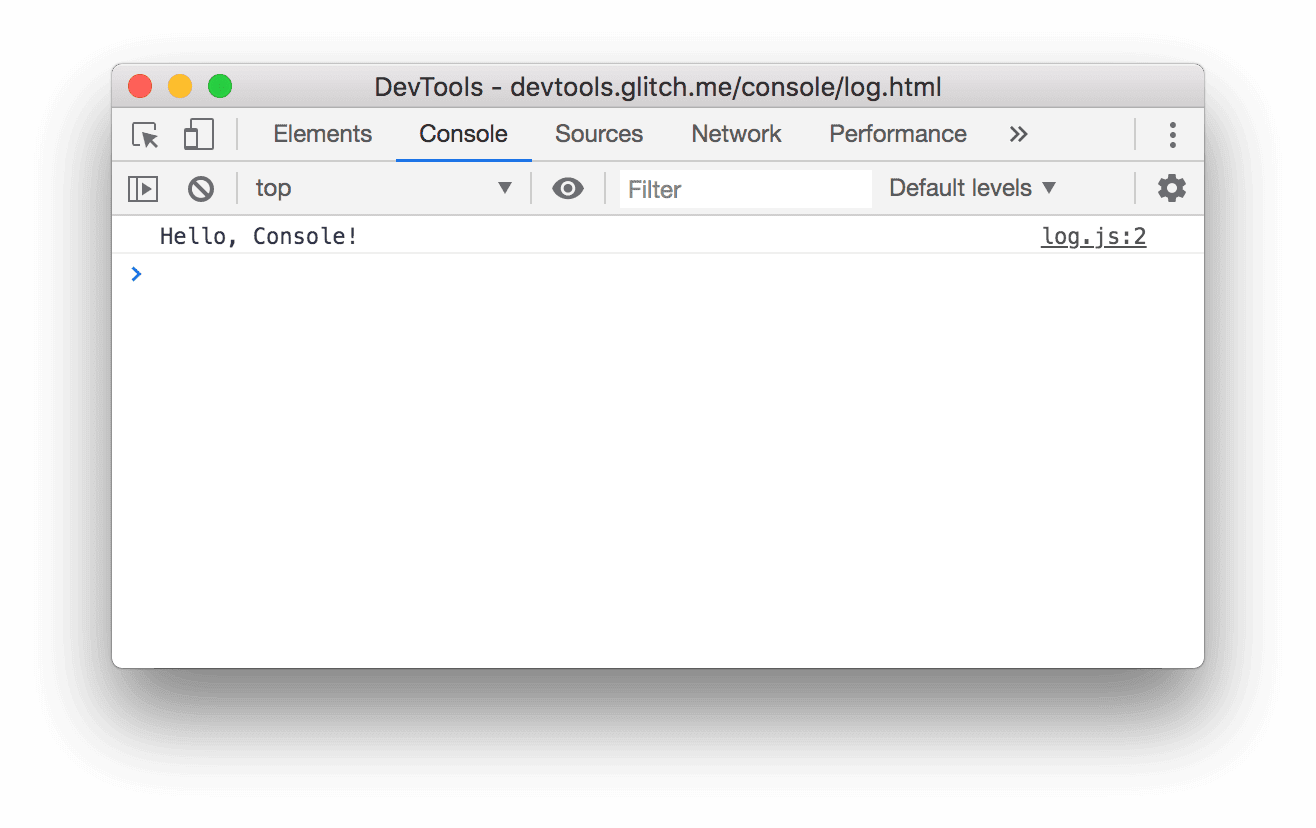
Click the Log Info button in the demo.
Hello, Console!gets logged to the Console.Next to the
Hello, Console!message in the Console, click log.js:2. The Sources panel opens and highlights the line of code that caused the message to get logged to the Console.The message was logged when the page's JavaScript called
console.log('Hello, Console!').Navigate back to the Console using any of the following workflows:
- Click the Console tab.
- Press Control+[ or Command+[ (Mac) until the Console is in focus.